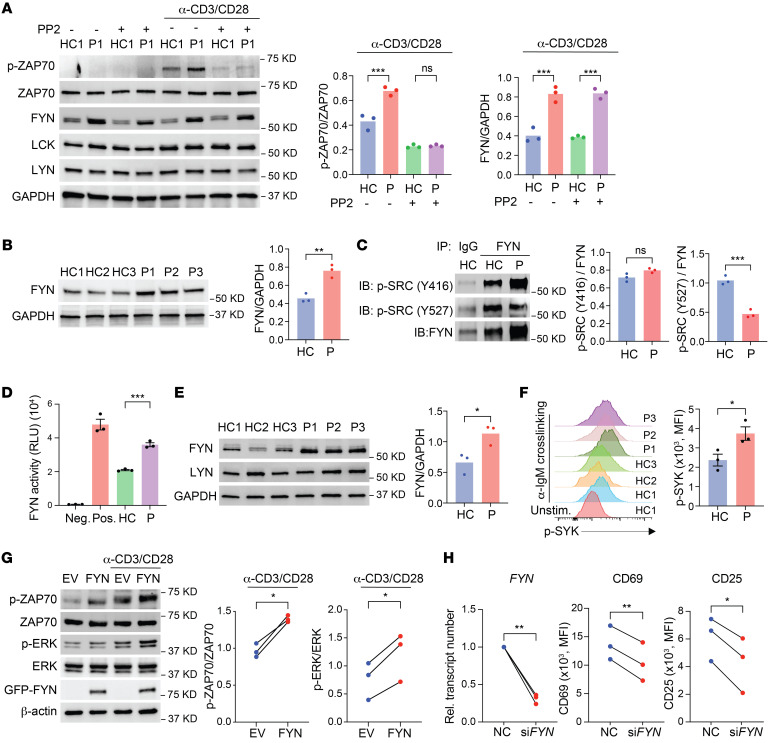
Figure 4. FYN abundance and activity are upregulated in the patients.
(A) Immunoblot analysis of T cell blasts treated with or without PP2 (1 μM) left unstimulated or followed by anti-CD3/anti-CD28 stimulation for 15 minutes. Representative blot is from 1 healthy control and 1 patient and summary intensities are from 3 experiments. (B) Immunoblot analysis of FYN in T cell blasts derived from healthy controls (n = 3) and the patients (n = 3) after anti-CD3/anti-CD28 stimulation for 24 hours. (C) Immunoprecipitation of FYN from T cell blasts derived from 1 healthy control and 1 patient after 15 minutes of anti-CD3/anti-CD28 stimulation and immunoblot (IB) analysis of FYN phosphorylation at activating and inhibitory sites, normalized to FYN. (D) Kinase activity of FYN in T cell blasts derived from healthy controls (n = 3) and patients (n = 3) after anti-CD3/anti-CD28 stimulation for 15 minutes. Negative (Neg.) and positive (Pos.) indicate results from system controls. (E) Immunoblot analysis of EBV-transformed B cell lines from healthy controls (n = 3) and the patients (n = 3). (F) SYK phosphorylation measured by flow cytometry in EBV transformed B cell lines from healthy controls (n = 3) and patients (n = 3) after anti-IgM cross-linking for 5 minutes. (G) Immunoblot analysis of naive CD4+ T cells from healthy individuals; cells were lentivirally transduced with empty vector (EV) or a vector encoding FYN. Cells were left unstimulated or stimulated with anti-CD3/anti-CD28 for 15 minutes. Representative blots and intensity results from 3 independent experiments are shown. (H) T cell blasts derived from healthy controls (n = 3) and patients (n = 3) were transfected with control siRNA or FYN siRNA. FYN mRNA levels were determined by qPCR. CD69 and CD25 levels were determined by flow cytometry. Rel., relative. Data represent the mean ± SEM. *P < 0.05, **P < 0.01, and ***P < 0.001, by 1-way ANOVA (A), 2-tailed, unpaired Student’s t test (B, D, E, and F), or 2-tailed, paired Student’s t test (G and H).

