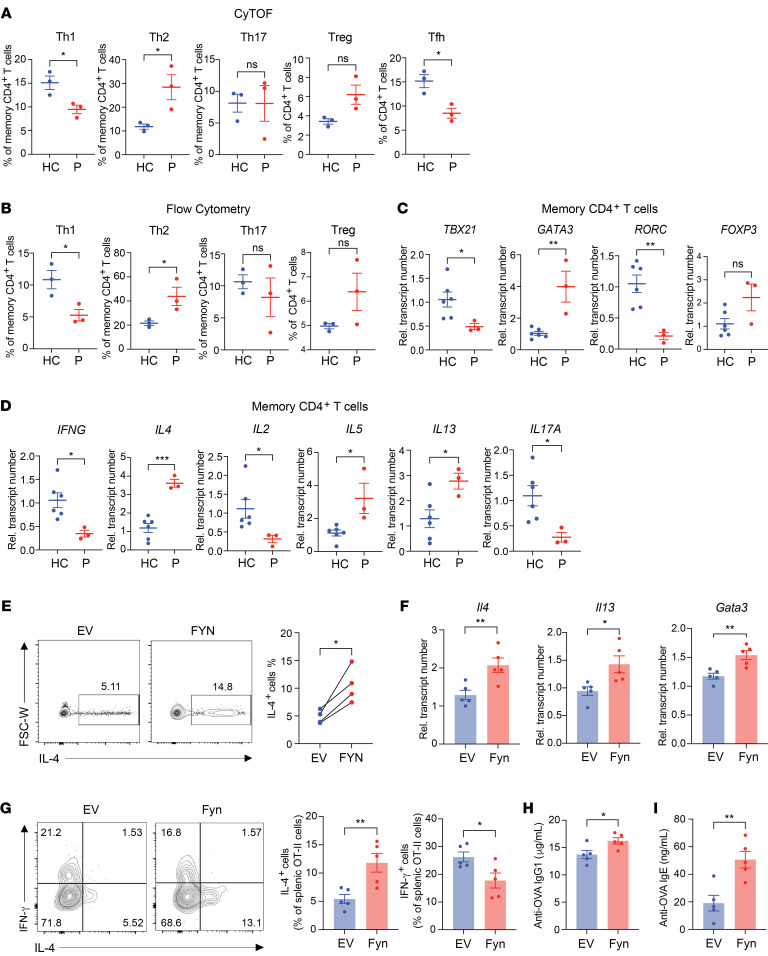
Figure 6. Th2 skewing in affected family members is caused by an IKAROS-mediated increase in FYN.
(A and B) Frequencies of Th1 (CD3+CD4+CCR4–CXCR3+CCR6–), Th2 (CD3+CD4+CCR4+CXCR3–CCR6–), Th17 (CD3+CD4+CCR4+CXCR3–CCR6+), Treg (CD3+ CD4+CD25+CD127–), and T follicular helper (Tfh) (CXCR5+CD4+) cells in healthy controls (n = 3) and patients (n = 3) were determined by mass cytometry (A) and confirmed by flow cytometry (B). (C and D) Memory CD4+ T cells from healthy controls (n = 6) and patients (n = 3) were stimulated with PMA and ionomycin for 2 hours. Plots show the relative transcript expression of lineage-determining transcription factors (C) and intracellular cytokines (D). (E) Naive CD4+ T cells from healthy individuals were lentivirally transduced with empty vector or vector encoding FYN. Cells were cultured on anti-CD3/anti-CD28–coated plates for 7 days under nonpolarizing conditions. Intracellular production of IL-4 in transduced cells was determined after PMA and ionomycin treatment for 6 hours. FSC-W, forward scatter width. (F–I) Empty vector control or FYN retrovirally transduced naive OT-II CD4+ T cells were adoptively transferred into recipient mice followed by NP-OVA immunization. (F) At day 8 after immunization, mRNA expression in splenocytes was analyzed by qPCR. (G) Intracellular production of IFN-γ and IL-4 in transduced cells was then determined after PMA and ionomycin treatment for 6 hours. Serum anti-OVA IgG1 (H) and IgE (I) levels were determined by ELISA. Data represent the mean ± SEM. *P < 0.05, **P < 0.01, and ***P < 0.001, by 2-tailed, unpaired (A–D and F–I) or 2-tailed, paired (E) Student’s t test.

