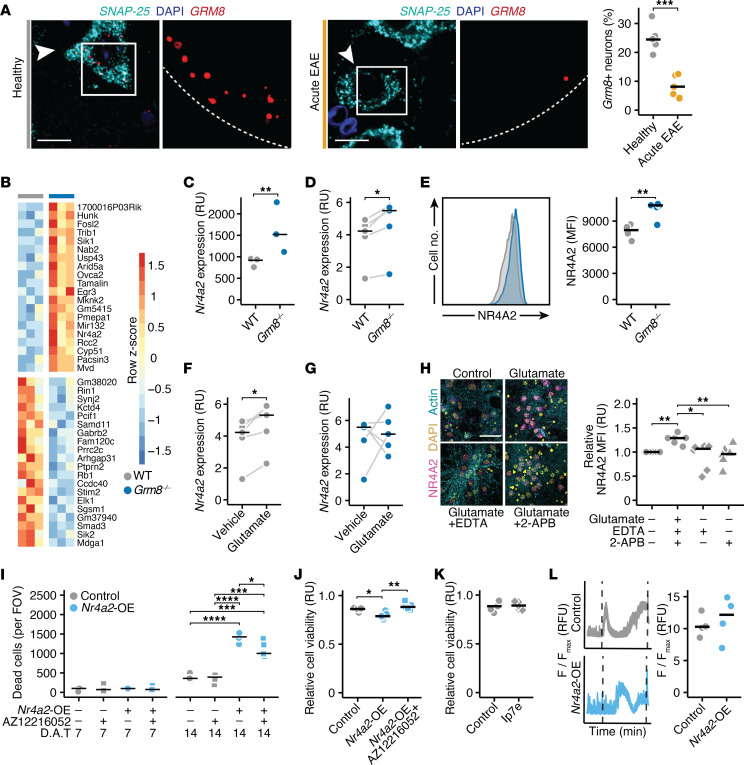
Figure 1. NR4A2 is induced in Grm8-deficient neurons.
(A) The number of Grm8+ neurons assessed by RNAScope in cervical spinal cords of healthy and EAE mice 15 days after immunization (n = 5). Scale bar: 20 μm. (B) Heatmap of top 15 up and downregulated genes in NeuN+ cortical nuclei of Grm8–/– compared with WT mice (n = 3). (C) Relative Nr4a2 expression in NeuN+ cortical nuclei of Grm8–/– and WT mice in relative units (RU). (D) Nr4a2 expression (RU) in WT and Grm8–/– primary cortical neurons (PCNs; n = 5). Paired t test was performed. (E) NR4A2 mean fluorescence intensity (MFI) in cortical neuronal nuclei estimated by flow cytometry of WT (n = 4) and Grm8–/– mice (n = 5). (F and G) Nr4a2 expression (RU) in WT (F) and Grm8–/– (G) PCNs after glutamate stimulation (n = 5). Paired t test was performed. (H) NR4A2 MFI in PCNs that were treated with glutamate and vehicle, 2 mM EDTA or 50 μM 2-APB (n = 6). Scale bar: 20 μm. (I) Dead cells per field of view (FOV) of control (mScarlet) or Nr4a2-overexpressing PCNs 7 days after transduction (D.A.T.; left) and 14 D.A.T. (right). PCNs were treated with vehicle or 1 μM AZ12216052 every other day (n = 5). (J and K) Viability (RU) of control (mScarlet) or Nr4a2-overexpressing PCNs that were exposed to glutamate and vehicle or 1 μM AZ12216052 (n = 5, J) or 50 nM Ip7e (n = 5; K). (L) Calcium traces and somatic calcium accumulation in glutamate-treated control (mScarlet) or Nr4a2-overexpressing PCNs (n = 4). Points represent individual experiments, additionally, the mean is shown. If not stated otherwise, unpaired t test with FDR correction for multiple comparisons was used. *P < 0.05, **P < 0.01, ***P < 0.001, ****P < 0.0001.

