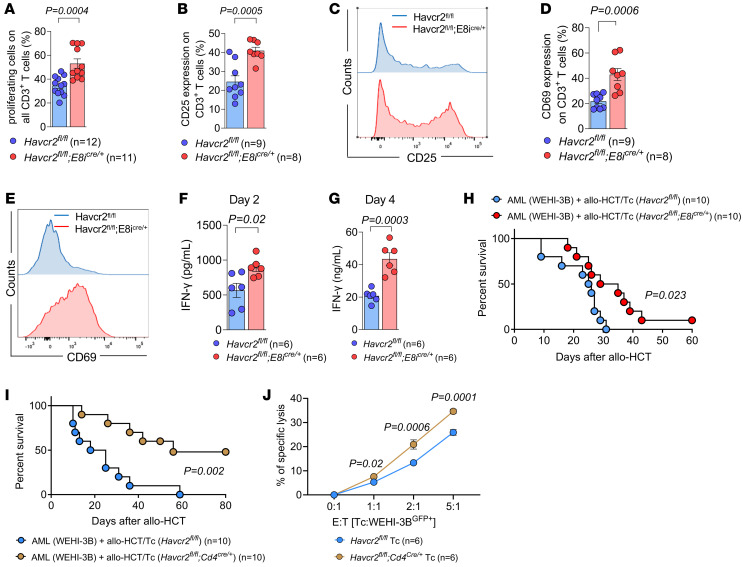
Figure 4. Genetic TIM-3 deletion in CD8+ Tc enhances Tc activation, proliferation, and IFN-γ production as well as GVL effects.
(A–E) Tc labeled with CTV (responders, C57BL/6) were cocultured for 6 days with allogeneic non-CD3 cells (stimulators, BALB/c). Responder cells were isolated from mice carrying TIM-3 deletion in CD8+ Tc (Havcr2fl/fl;E8icre/+) as described (23). (A) Proportion of proliferative cells was quantified at day 6 as the percentage of CTVlo cells in Havcr2fl/fl;E8icre/+ CD3+ responder Tc. (B) CD25 expression in proliferative CD3+ responder cells was quantified at day 6 by FC. (C) Representative staining of CD25 expression in Havcr2fl/fl (blue line) and in Havcr2fl/fl;E8icre/+ cells (red line). (D) CD69 expression in proliferative CD3+ responder cells was quantified at day 6 by FC. (E) Representative staining of CD69 expression in Havcr2fl/fl (blue line) and in Havcr2fl/fl;E8icre/+ cells (red line). (F and G) Production of IFN-γ in the supernatant of the culture analyzed at the indicated time points by ELISA. P values were calculated using an unpaired Student’s t test. (H and I) Kaplan-Meier plots showing survival of mice in the indicated groups. BALB/c recipient mice were injected i.v. with WEHI-3B AML cells (BALB/c background) and (H) allogeneic Havcr2fl/fl (n = 10) or Havcr2fl/fl;E8icre/+ (n = 10) BM and Tc or (I) allogeneic Havcr2fl/fl (n = 10) or Havcr2fl/fl;Cd4cre/+ (n = 10) BM and Tc. Data were pooled from 2 independent experiments, and P values were calculated using the 2-sided Mantel-Cox test. (J) Percentage of specific lysis of αCD3/CD28-activated Tc isolated from Havcr2cKO mice in contact with WEHI-3B cells. E:T (effector [Tc] to target [WEHI-3B cell]) ratio was titrated between 5:1 and 1:1, as indicated. Individual values are shown and mean ± SD of Havcr2fl/fl (n = 6) or Havcr2fl/fl;Cd4cre/+ (n = 6). P values were calculated using 2-way ANOVA followed by Šidák’s multiple-comparisons test.

