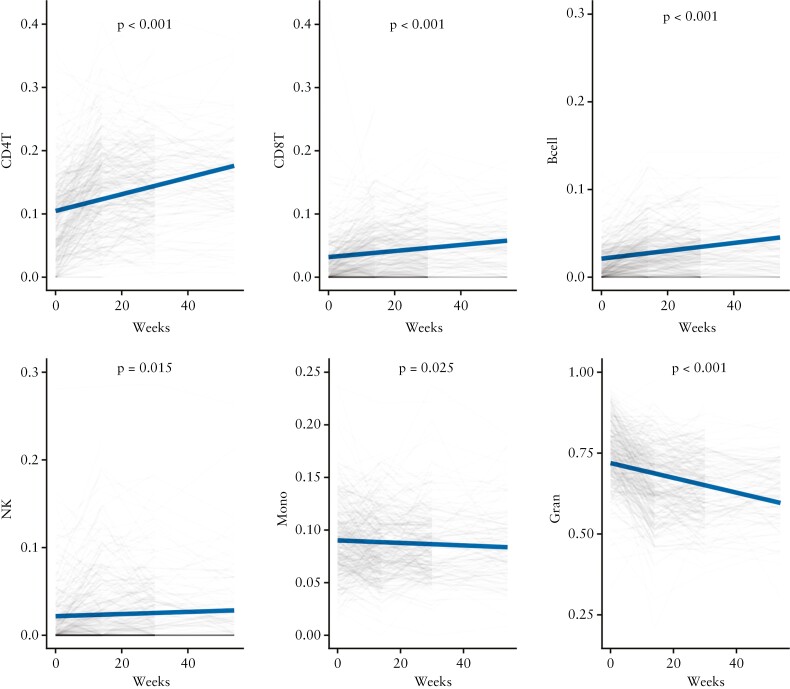
Figure 1.
Change in derived cell proportions following treatment with anti-TNF. Predicted derived cell proportions over time estimated from the regression analysis is represented in solid blue lines, and observed cell proportions in faded lines; p-value represents the change in individual cell proportions over time. TNF, tumour necrosis factor.

