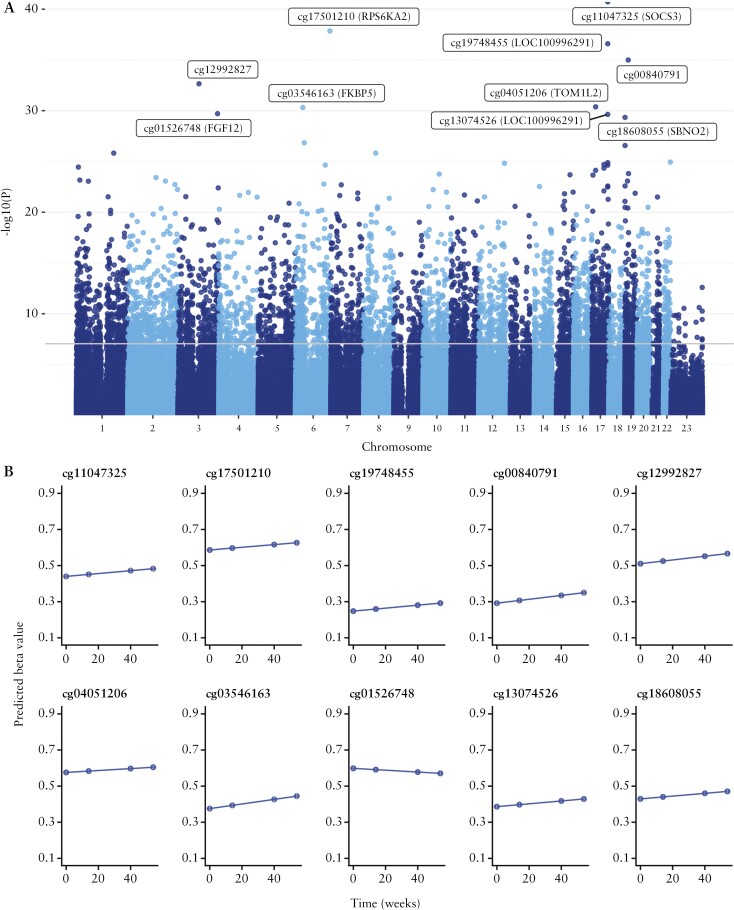
Figure 2.
CpG sites associated with change over time following anti-TNF treatment regardless of treatment outcome. A] Manhattan plot of CpG sites associated with change over time following anti-TNF treatment regardless of treatment outcome. The top 10 differentially methylated positions with annotations are labelled in the plot. The grey horizontal line represents the significant p-value threshold of 9 x 10⁻⁸. B] Predicted beta values of the top 10 differentially methylated positions and its change over time following anti-TNF treatment. TNF, tumour necrosis factor.

