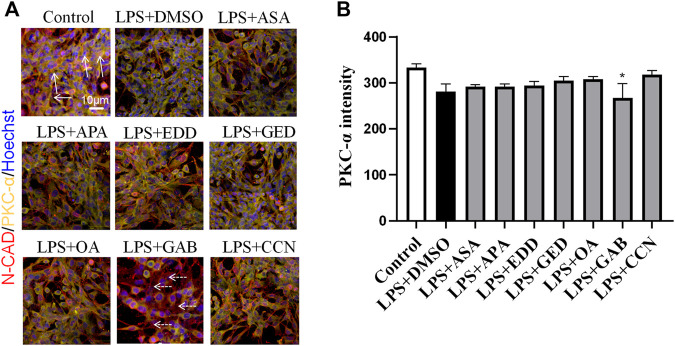
FIGURE 12.
High-Content Screening Results of the Blood-Brain Barrier Cell Model (A) Immunofluorescence images of the blood‒brain barrier cell model. N-Cadherin in astrocyte membranes is shown in red, PKC-ɑ is shown in yellow, and nuclei are shown in blue. The white arrows indicate PKC-ɑ. The white dashed arrows indicate the region with reduced PKC-α(N = 6); the scale bar represents 10 μm. (B) Statistical analysis of PKC-α expression on astrocyte The error bars represent the means ± SEMs. *p < 0.05 vs. Sham + NS.

