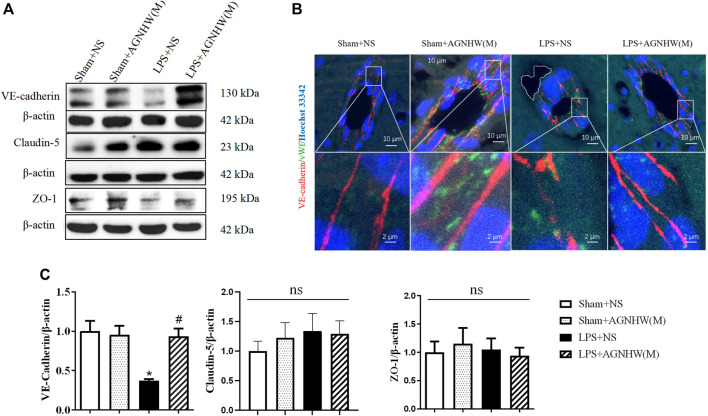
FIGURE 3.
The effect of AGNHW on Cell-Cell Junction Protein Expression and Perivascular Edema in the Mouse Brain Microvasculature. (A) Western blot results showing the expression of cell‒cell junction proteins in mouse brain tissue. (B) Immunofluorescence staining images of frozen mouse brain tissue sections. VE-Cadherin in endothelial intercellular junctions is shown in red, the endothelial cell marker vWF is shown in green, and nuclei are shown in blue. The white dashed lines encircle perivascular edema in the brain endothelium (N = 5); the scale bar represents 10 μm. The area indicated by the white dashed line represents perivascular edema around cerebral microvessels. (C) Statistical analysis of the expression of cell‒cell junction proteins in the mouse brain (N = 6). The error bars represent the means ± SEMs. *p < 0.05 vs. Sham + NS, #p < 0.05 vs. LPS + NS.

