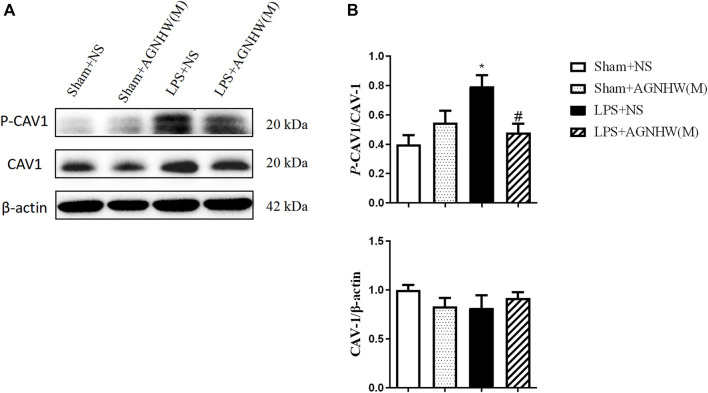
FIGURE 4.
The Effect of AGNHW on the Phosphorylation of CAV-1 in Mouse Brain Tissue (A) Western blot results showing the expression of CAV-1 and phosphorylation of CAV-1 in the mouse brain. (B) Statistical graph of the expression of CAV-1 and phosphorylation of CAV-1 in the mouse brain (N = 6). The error bars represent the means ± SEMs. *p < 0.05 vs. Sham + NS, #p < 0.05 vs. LPS + NS.

