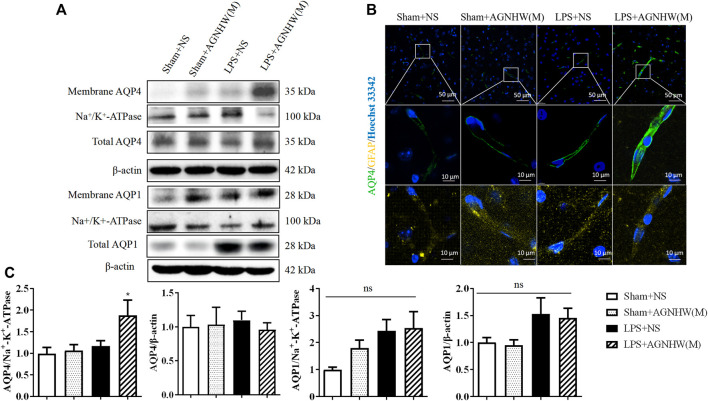
FIGURE 5.
The effect of AGNHW on the Total and Membrane Expression of AQP4 and AQP1 in Mouse Brain Tissue (A) Western blot results showing the expression of AQP1 and AQP4 in the cell membrane and total AQP1 and AQP4 in the mouse brain. (B) Immunofluorescence staining images of frozen mouse brain tissue sections. AQP4 is shown in green, GFAP in yellow, and nuclei in blue (N = 5). The scale bar represents 10 μm. (C) Statistical analysis of AQP1 and AQP4 expression in the cell membrane and total AQP1 and AQP4 expression in mouse brain tissue by Western blot (N = 6). The error bars represent the means ± SEMs. *p < 0.05 vs. Sham + NS.

