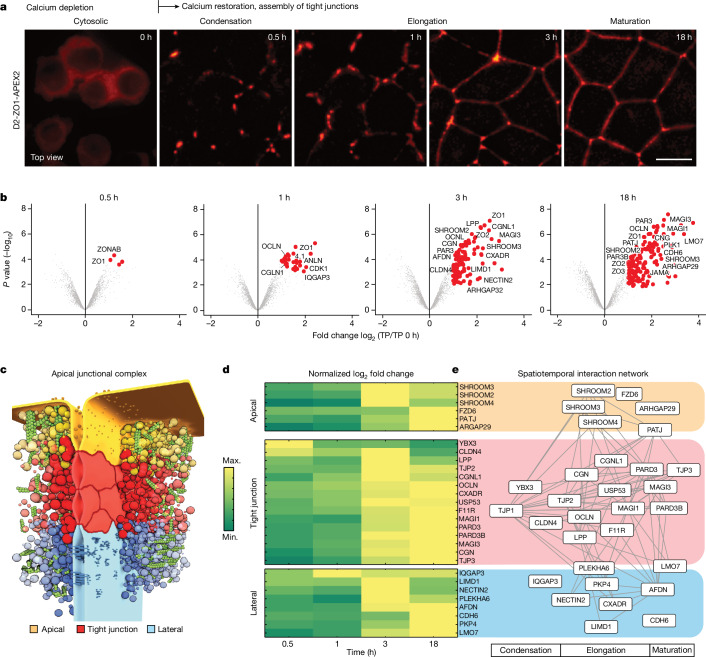
Fig. 1. Proximity proteomics of ZO-1 condensates during tight-junction formation.
a, Live imaging of tight-junction belt formation after calcium switch of MDCK-II monolayer expressing Dendra2–ZO-1–APEX2 (n = 3 biological replicates). The morphological stages of the ZO-1 belt are indicated. b, Volcano plots displaying log2 fold change in abundance of biotinylated proteins proximal to ZO-1 compared with time point zero against −log10 P values at different stages of tight-junction formation. P values were calculated using moderated t-statistics after Benjamini–Hochberg adjustment using the limma package in R for each time point. Proteins with FDR < 0.05 and fold change ≥ 2 were considered to be significantly enriched and are depicted in red. Background proteins are shown in grey. Selected junctional proteins are annotated (see Extended Data Fig. 1 for setup and controls for APEX2). c, Scheme of the apical–junction complex showing three subcompartments: apical (yellow), tight junction (red) and lateral (blue) along the epithelial membrane. d, Heat map of normalized log2 fold change values for selected apical, tight-junction and lateral proteins over time (Supplementary Table 2). e, Spatiotemporal protein interaction network relating the known positions of proteins (apical, junctional, lateral) to the arrival kinetics revealed by the ZO-1–APEX2 proteomics. Scale bar, 10 µm.

