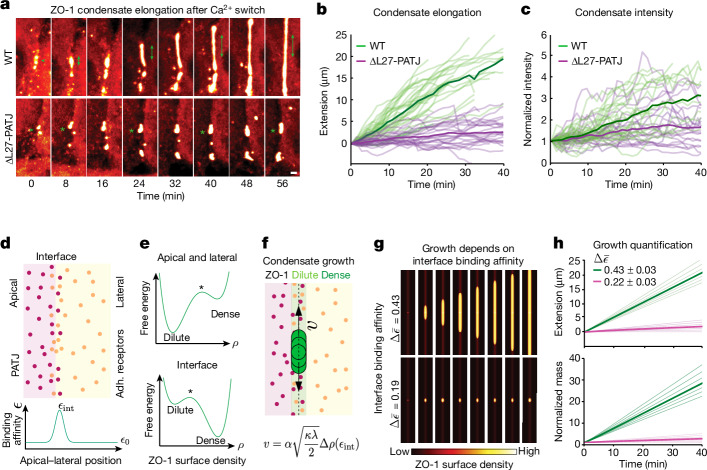
Fig. 4. Thermodynamics of a prewetting transition explain observed elongation dynamics.
a, ZO-1 condensates nucleate at the cell–cell interface (arrows), elongate and fuse into a continuous belt (double-sided arrow) in WT cells. In ∆L27-PATJ cells, condensates nucleate but fail to elongate along the interface (stars). b, Traces showing extensions of single condensate in WT and ∆L27-PATJ (Extended Data Fig. 5a–c). Bold lines indicate the mean of n = 32 WT and n = 24 ∆L27-PATJ traces. c, Total condensate intensity normalized to initial intensity of each condensate in WT and ∆L27-PATJ. Bold lines indicate the mean of n = 31 WT and n = 19 ∆L27-PATJ traces. d, Sketch of the polarized membrane domains: apical, lateral and interface. Bottom diagram depicts the binding affinity of ZO-1 to the membrane, which is highest at the interface. e, Thermodynamic free energy as a function of ZO-1 surface density. For the apical and lateral membrane (top), the dilute phase has the lowest free energy, whereas at the apical–lateral interface (bottom), owing to a higher binding affinity, the condensed phase has the lowest free energy. f, Sketch of elongation of a nucleated ZO-1 condensate along the apical–lateral membrane interface via a prewetting transition. The derived growth velocity of surface condensates as a function of binding affinity to the apical interface is shown (Extended Data Fig. 5e,l and Supplementary Note 1). g, Numerical solutions to the surface condensation theory for two different values of the relative binding affinity of ZO-1 to the interface. Dynamics for (top) and (bottom). h, Theoretical condensate extension (top) and mass increase (bottom) as functions of binding affinity. Solid green and magenta lines correspond to relative binding affinities and , respectively. The dim lines correspond to relative binding affinities and , respectively. a, b and c show n = 4 biological replicates. Scale bar, 1 µm.

