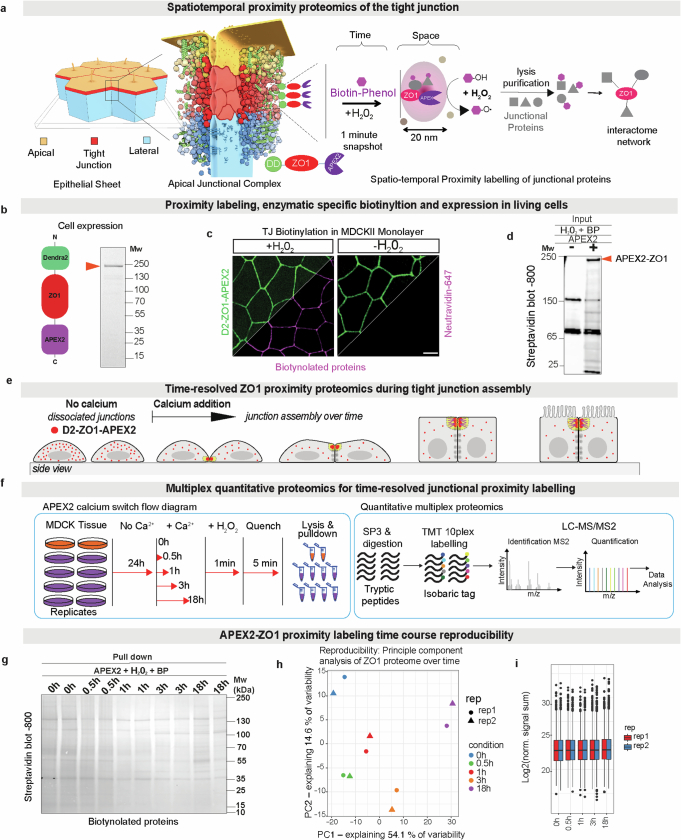
Extended Data Fig. 1. Experimental pipeline of time-resolved ZO-1-APEX2 proximity proteomics.
(a) Scheme of labelling D2-ZO-1-APEX2 to identify protein interactions at the apical junctional complex. After activation for 1 min, proteins in proximity ( < 20 nm) to the ZO-1 get biotinylated and are identified using mass spectrometry. (b) D2-ZO-1-APEX2 genetic construct and protein gel of the fusion protein in MDCK-II cells with a Mw ~ 250 kDa. (c) Localization of the D2-ZO-1-APEX2 at the tight junction with H2O2 specific activation and biotinylation of APEX2. Scale bar 10 µm. (d) Activation of APEX2 and biotinylation pattern (+/− H2O2) by western blot. (e) Scheme of tight junction assembly and D2-ZO1-APEX2 localization during the calcium switch in epithelia. (f) Time-resolved proximity labelling, biotinylated proteins purified by streptavidin pull down, SP3 enrichment, digestion, TMT labelling and quantitative mass spectrometry. (g) Western blot of the biotinylated proteins after pull-down at different time points used for proteomics. (h) Principal component analysis (PCA) plots of the proteome cross the different time points of the ZO-1-APEX2 proximity proteomics. The coloured dots and triangle represent the n = 2 biological replicate and the different colour the time points (red, blue, orange, violet and green). PCA show the clusters changed in a reproducible manner. (i) Protein intensities of all samples at different time points show that protein content did not change. Plot shows the normalized signal sum in the biological replicates across all time points. Data represents center lines medians, box borders represent the interquartile range (IQR), and whiskers extend to ±1.5× the IQR; outliers are shown as black dots. Panels b,d show representative images of n = 3 and g of n = 2 biological replicates.

