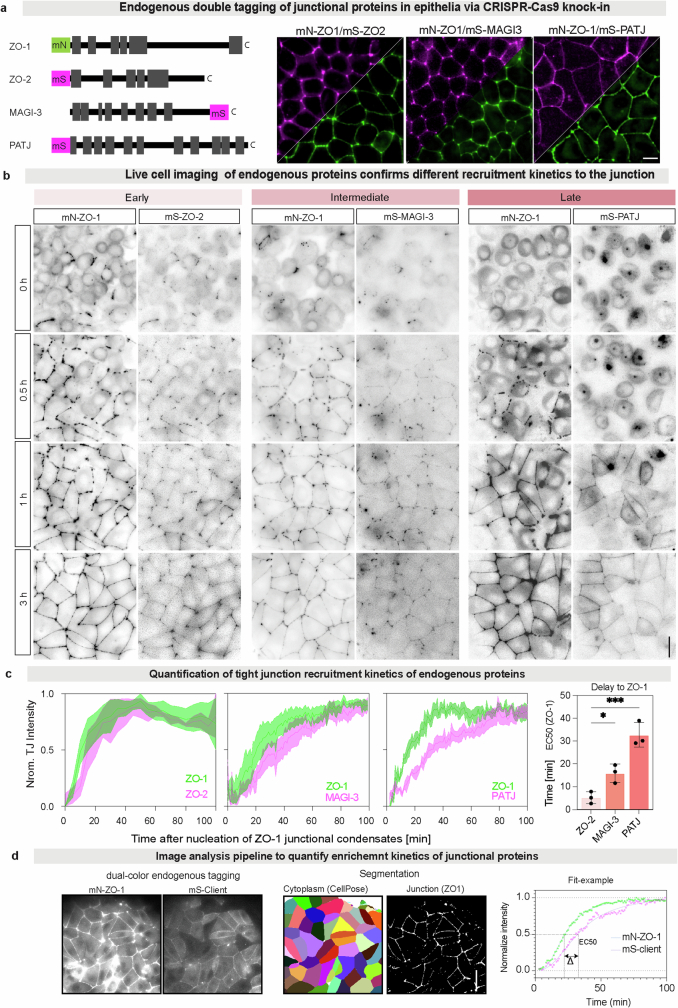
Extended Data Fig. 2. Live-imaging of endogenous proteins show recruitment kinetics to ZO-1 condensates.
(a) Double fluorescence tagging via CRISPR/Cas9 mediated knock-in of mN-ZO1 (green) and mS-ZO2, mS-MAGI3 or mS-PATJ (magenta) in MDCK-II cells. Dual-color imaging of the cell lines in confluent monolayers confirmed mN-ZO-1 co-localization with tagged proteins. (b) Calcium switch imaging of the double tagged cell lines. Snapshots of same time steps as used for the APEX2 proximity proteomics are shown with inverted color maps (0.5 h,1 h,3 h). Scale bar 10 µm. (c) Quantification of protein enrichment in mN-ZO-1 condensates compared to the cytoplasm over time. Plots show the normalized enrichment of mS-ZO-2, mS-MAGI-3 and mS-PATJ (magenta) at the tight junction compared to mN-ZO-1 (green), data shows mean ± SD of n = 3 independent experiments. Kinetics were fitted with a Hill binding model. The half-time plot of recruitment compared to mN-ZO-1. Significant comparison in reference to ZO-2 (early) using a one-way ordinary ANOVA test correct for multiple comparations with Dunnett (not significant (n.s), p > 0.12; *p < 0.034, **p < 0.002. (d) Image analysis pipeline showing time-resolved two-color imaging of junction assembly. Cells were segmented using CellPose. ZO-1-condensates were segmented using local intensity threshold of mN-ZO1. Junction enrichment was calculated locally for every cell as the ratio of junctional and cytoplasmic fluorescence intensity. Quantification of junction arrival time by fitting junction enrichment kinetics with Hill binding model. Delta between ZO-1 and each client protein represents the different arrival time. Panels a, b show representative images of n = 3 biological replicates.

