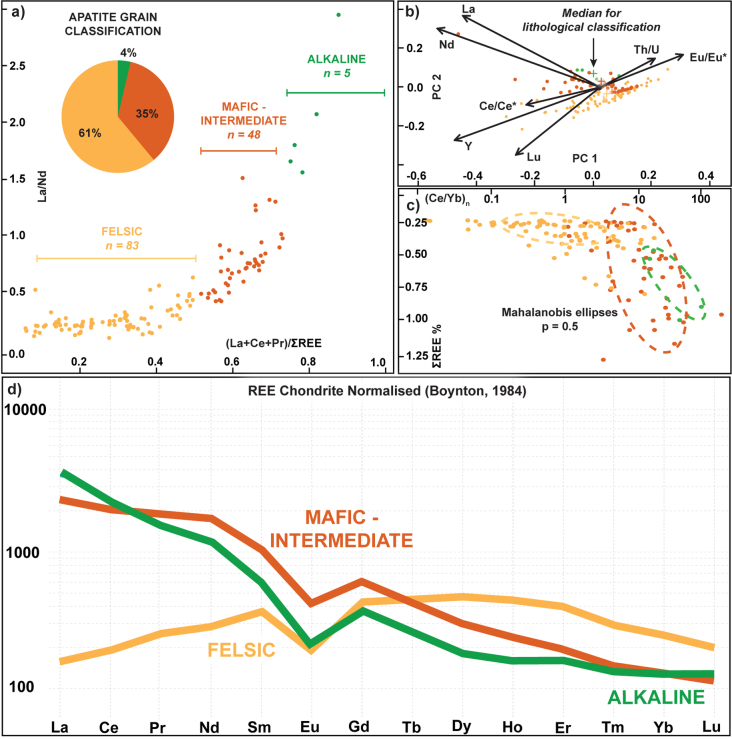
Extended Data Fig. 7. Apatite trace element classification plots for the Altar Stone thin-section MS3.
Colours for all plots follow the geochemical discrimination defined in A. a, Reference 29 classification plot for apatite with an inset pie chart depicting the compositional groupings based on these geochemical ratios. b, The principal component plot of geochemical data from apatite shows the main eigenvectors of geochemical dispersion, highlighting enhanced Nd and La in the distinguishing groups. Medians for each group are denoted with a cross. c, Plot of total rare earth elements (REE) (%) versus (Ce/Yb)n with Mahalanobis ellipses around compositional classification centroids. A P = 0.5 in Mahalanobis distance analysis represents a two-sided probability, indicating that 50% of the probability mass of the chi-squared distribution for that compositional grouping is contained within the ellipse. This probability is calculated based on the cumulative distribution function of the chi-squared distribution. d, Chondrite normalized REE plot of median apatite values for each defined apatite classification type.

