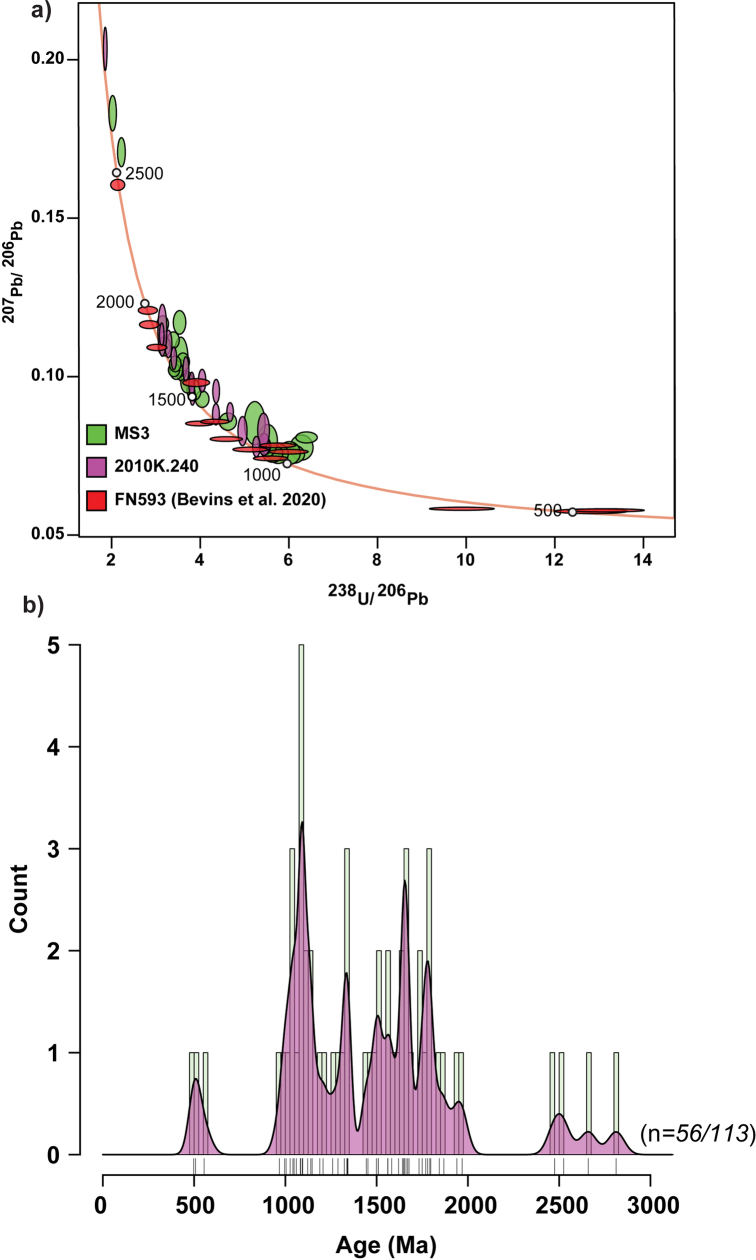
Extended Data Fig. 2. Altar Stone zircon U–Pb data.
a, Tera-Wasserburg plot for all concordant (≤10% discordant) zircon analyses reported from three samples of the Altar Stone. Discordance is defined using the concordia log % distance approach, and analytical ellipses are shown at the two-sigma uncertainty level. The ellipse colour denotes the sample. Replotted isotopic data for thin-section FN593 is from ref. 1. b, Kernel density estimate for concordia U–Pb ages of concordant zircon from the Altar Stone, using a kernel and histogram bandwidth of 50 Ma. Fifty-six concordant analyses are shown from 113 measurements. A rug plot is given below the kernel density estimate, marking the age of each measurement.

