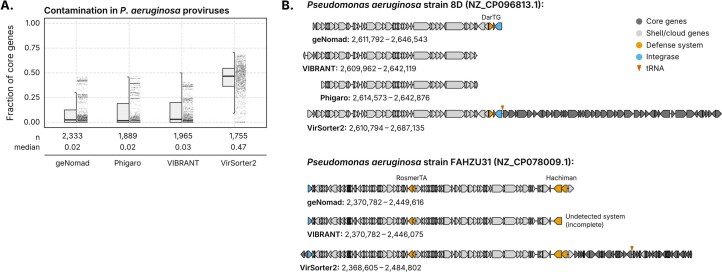
Extended Data Fig. 6. geNomad outperforms other tools in identifying proviruses in the Pseudomonas aeruginosa pangenome.
(a) Distribution of the contamination estimates of multiple provirus-identification tools, measured at the gene-level for each provirus. Contamination was measured as the number of core genes, as determined by PPanGGOLiN, in the provirus. The number of detected provirus and the median contamination of each tool are displayed below the graph. Box plots show the median (middle line), interquartile range (box boundaries), and 1.5 times the interquartile range (whiskers). (b) Defense system-encoding proviral regions demarcated with multiple tools in P. aeruginosa genomes. Shell and cloud genes are shown in light grey and core genes (putative contamination) are shown in dark gray. Genes that are part of defense systems are in orange. Integrase genes are in blue. tRNA loci are indicated by red arrows. GenBank accessions are shown within parenthesis. Phigaro did not detect any provirus within the 2,370,782–2,449,616 bp region in the NZ_CP078009.1 sequence.

