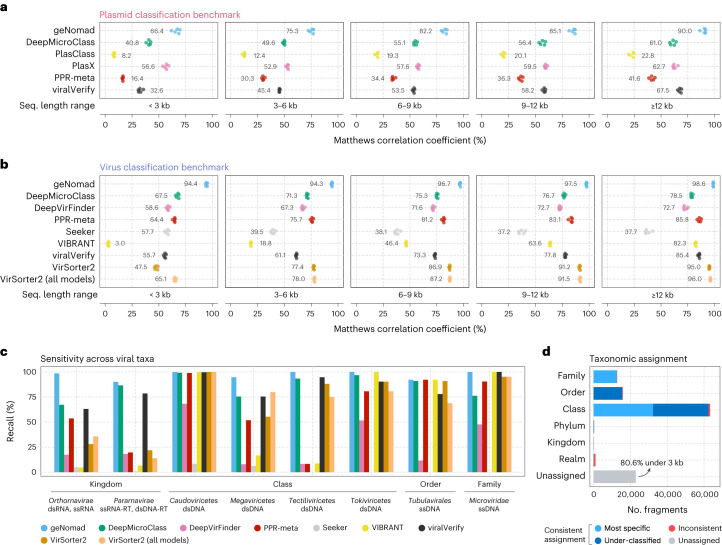
Fig. 3. geNomad accurately identifies viruses and plasmids and allows taxonomic assignment of viral genomes.
a,b, Classification performance of multiple plasmid (a) and virus (b) identification tools across sequence fragments of varying length. Performance was measured using the MCC. For each sequence range interval, tools were evaluated with five different test sets, each containing the sequences of one RC. Colored circles represent the performances measured in each test set. Mean values are shown next to the circles. c, Sensitivity of virus identification tools across major viral taxa at different ranks. The score cutoff of each tool was determined so that the FDR was approximately 5%. d, Virus taxonomic assignment performance. Bar lengths represent the number of sequence fragments assigned at a given taxonomic rank. Light blue represents sequences that were correctly assigned to their most specific rank (up to the family level); dark blue represents fragments that were assigned to the correct lineage but to a rank that is above its most specific rank; red represents sequences that were assigned to the wrong lineage; and the gray bar represents sequences that were assigned to any taxon.

