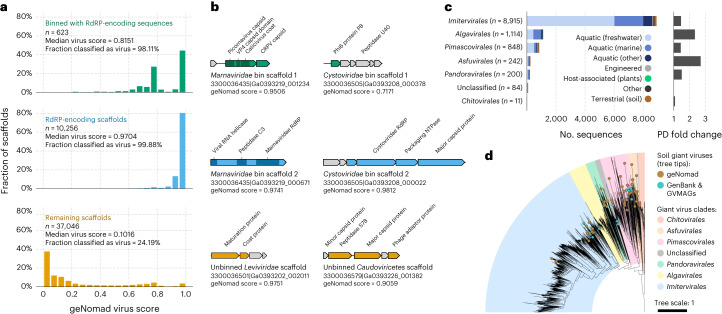
Fig. 5. geNomad allows the discovery of RNA viruses and giant viruses in environmental sequencing data.
a, Histograms showing the geNomad score distribution of three groups of scaffolds of the Sand Creek Marshes metatranscriptomes: scaffolds that binned with RdRP-encoding sequences (top row, in green); scaffolds that contain the RdRP gene (middle row, in blue); and the remaining scaffolds (bottom row, in orange). The median geNomad score and the fraction of scaffolds classified as viral are indicated for each group. b, Genome maps of selected sequences that were classified as viral by geNomad. Two pairs of co-occurring Orthornavirae scaffolds are represented (Marnaviridae and Cystoviridae bins). Genes targeted by geNomad markers are colored, and genes that do not match any marker are shown in gray. Rows and colors match those of a. c, Number of scaffolds assigned to Nucleocytoviricota orders across multiple ecosystems (left bar plot). Sequences were identified by geNomad in a large-scale survey of metagenomes of diverse ecosystems. Only scaffolds that are at least 50 kb long or more were evaluated. Bar colors represent the ecosystem types where the sequences were identified. The phylogenetic diversity (PD) fold change is shown on the right bar plot. PD fold change values correspond to the ratio between the total PD of trees reconstructed with and without geNomad-identified giant viruses. d, Maximum likelihood phylogenetic tree of soil giant viruses identified with geNomad (brown tree tips). Reference sequences from GenBank and from a previous metagenomic survey (GVMAGs) were included, and the ones that were sequenced from soil samples are indicated with turquoise tree tips. Tree tips that are not colored represent representative genomes sequenced from samples obtained from other ecosystems. The ranges corresponding to different Nucleocytoviricota orders are represented using distinct colors.

