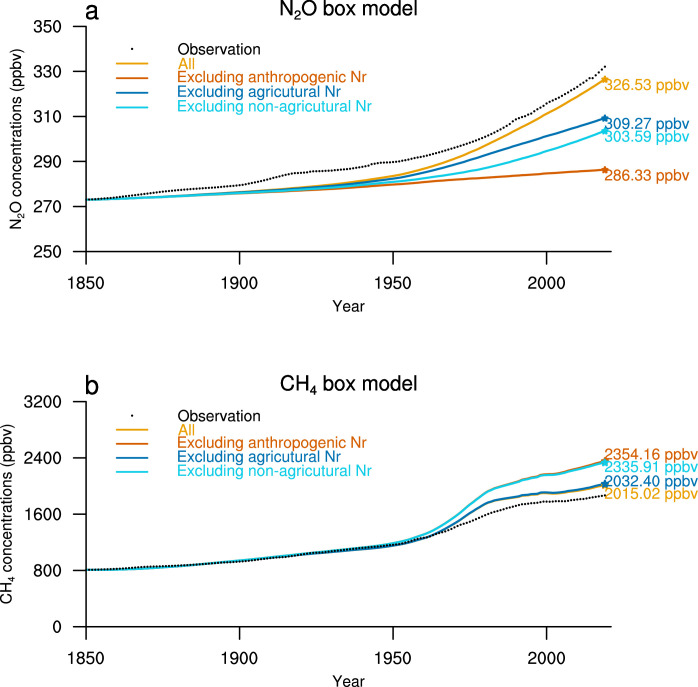
Extended Data Fig. 5. Global N2O and CH4 concentrations during 1850–2019 based on the box models.
a N2O concentration; and b CH4 concentration. The black dots indicate the historical annual N2O and CH4 concentrations, as observed from ice core, firn and atmospheric measurements101. Lines with different colors represent the different SSP scenarios. Concentration values indicate the global mean concentration in the year of 2019 derived from the box models.

