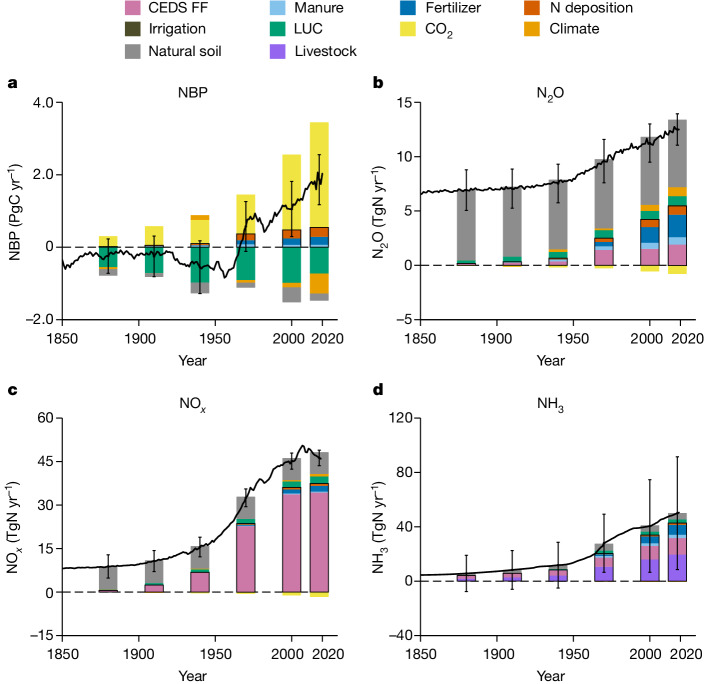
Fig. 2. Historical Nr emissions and terrestrial carbon fluxes based on CEDS inventory and NMIP2 ensemble mean.
a–d, The terrestrial NBP (a), N2O (b), NOx (c) and NH3 (d) emissions, respectively. All of the fossil fuel sources in CEDS are indicated by the pale violet bars, whereas other colours indicate factor contributions based on the NMIP2 ensemble mean. The soil NH3 emissions have been scaled by the CEDS agricultural emissions (Methods). The fire emission of each component is not included in the current NMIP2 configuration. The contributions of each factor were averaged over 1880s, 1910s, 1940s, 1970s, 2000s and 2020s with a 5-year time window, in which the direct anthropogenic Nr effects are shown with a black outline. Black lines indicate the ensemble mean annual flux of each compound and the error bars indicate 1 standard deviation among different NMIP2 members. FF, fossil fuel.

