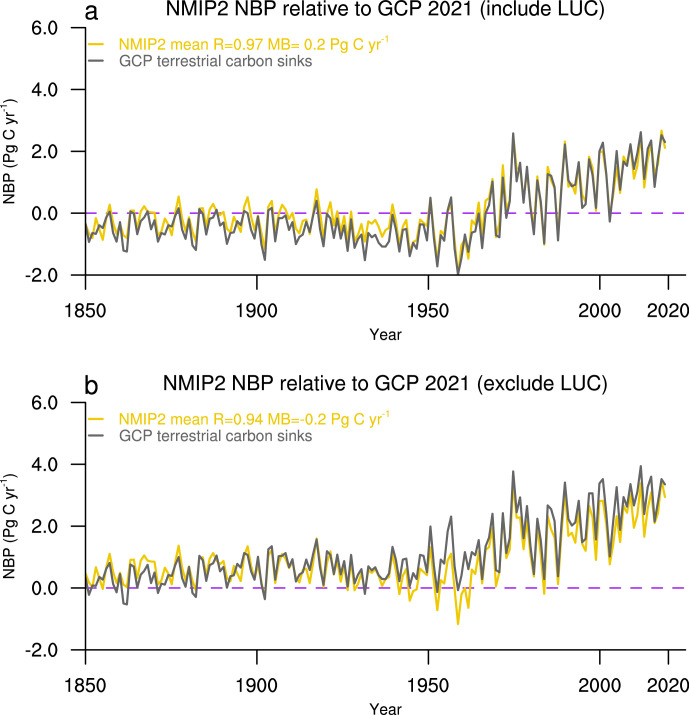
Extended Data Fig. 1. Comparison of net biome productivity (NBP) estimates from the NMIP2 ensemble and the Global Carbon Project (GCP2021).
The yellow and gray lines represent the NBP of NMIP2 ensemble and GCP202129 estimate, respectively. a and b show time series with and without the effect of land use change (LUC), respectively. The correlation coefficient (R) and mean bias (MB) of annual NBP between NMIP2 ensemble and GCP2021 are also given.

