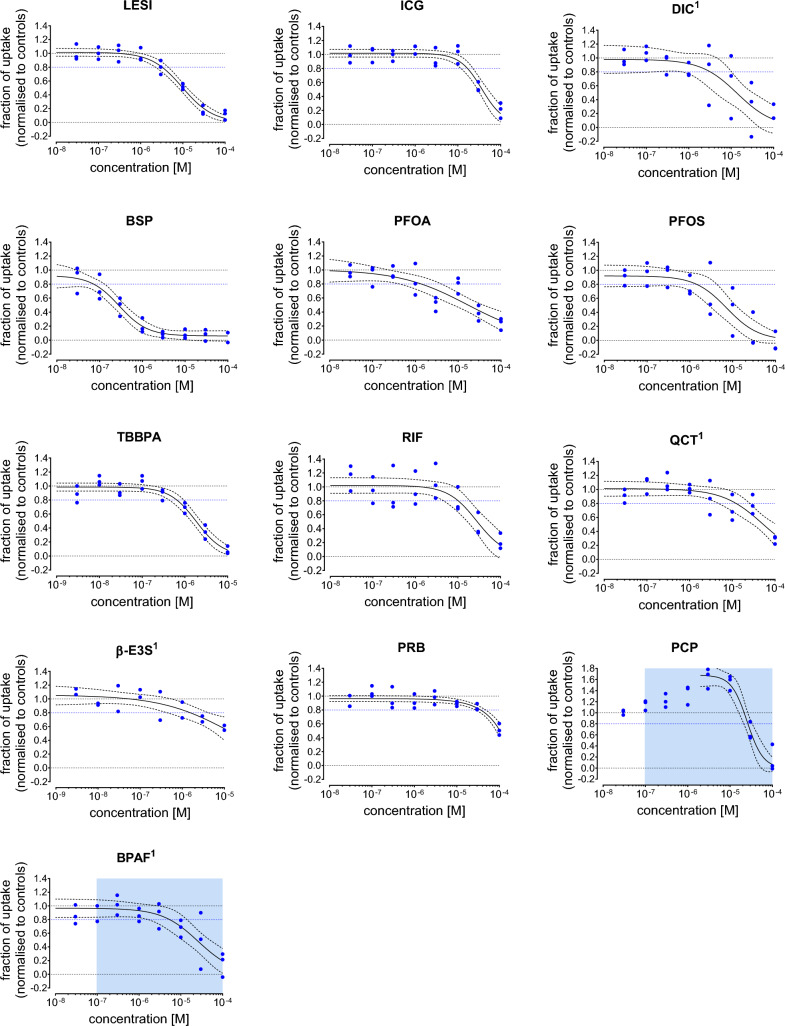
Fig. 4.
Concentration–response curves for test chemicals that showed OAT4 mediated uptake of T4 (10 nM) inhibition in the MDCK-OAT4 TH uptake assay. The fraction of 125I-T4 uptake is normalized to the positive control, 100 µM LESI (lower limit = 0.0) and to the DMSO control (upper limit = 1.0). Blue dots indicate the plate medians from three independent experiments, all control and chemical concentrations were tested in triplicates per plate. The black line indicates the best-fit concentrations response curve, the dotted line the corresponding 95% confidence interval. The blue dotted line indicates the BMC20, the concentration that inhibits the 125I-T4 uptake by 20%. The concentration range at which cytotoxicity was observed is indicated with a blue box. Compounds for which a control renormalization step was performed are marked with an1 (color figure online)

