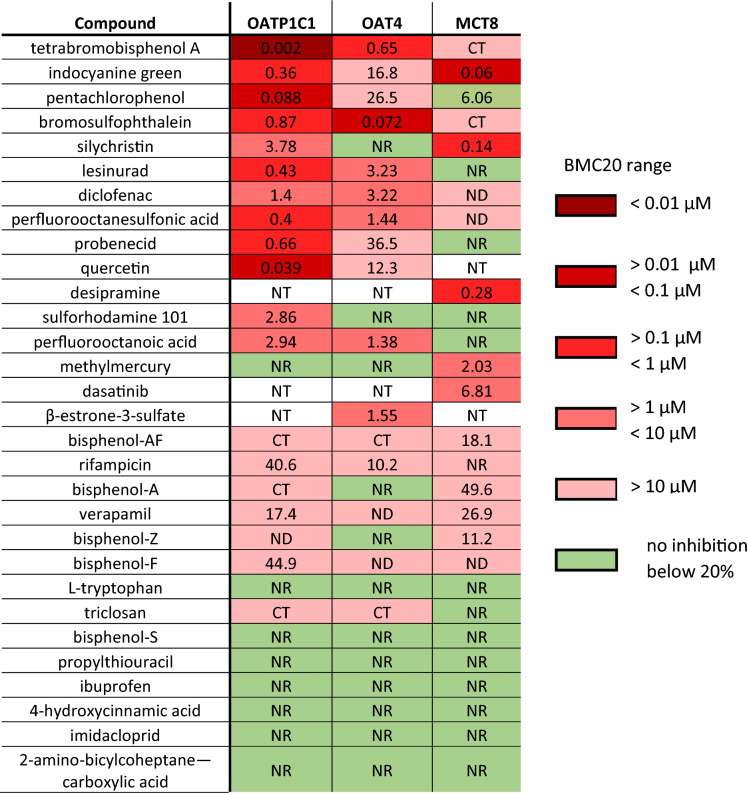
Fig. 5.
Overview of the potency of THTMT inhibitors on different THTMT TH uptake assays. Data for the MCT8 column was taken from Wagenaars et al. (2023). The calculated BMC20 value is given for each THTMT TH uptake assay, as well as a color graded range of BMC20 as shown in the figure legend. Compounds for which no inhibition below 20% was observed are marked in red. ND = no BMC20 value was determined, NR = no significant response observed, NT = not tested, CT = cytotoxic at BMC20 (color figure online)

