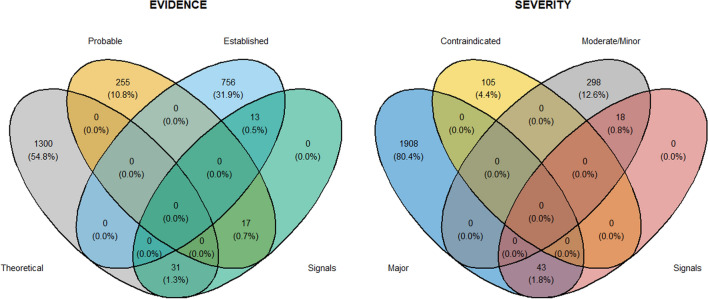
Fig. 4.
Venn diagrams of type of triplets reported as frequencies (percentages) and retrieved considering those that were identified as a disproportionality signal for the temporal plausibility assessment using our method. Definitions of evidence and severity levels are those reported by Kontsioti et al. [10] in their work: evidence—evidence level associated with the drug–drug interaction as shown in Micromedex; severity—severity level associated with the drug–drug interaction as shown in Micromedex

