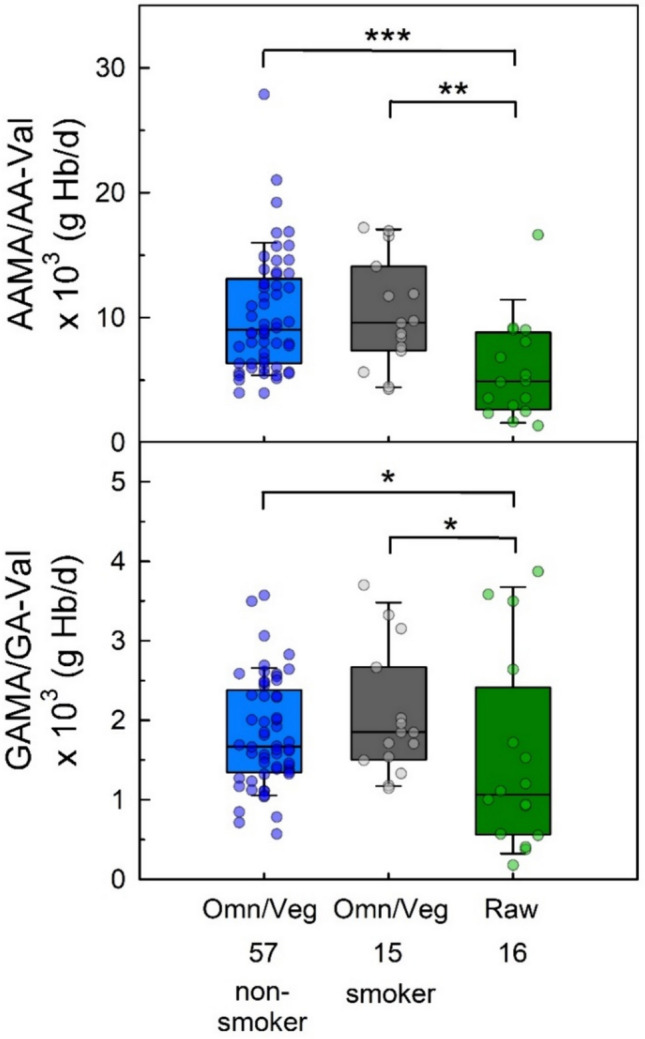
Fig. 5.

Ratios of daily AAMA excretion and AA-Val levels (in g Hb/day; upper panel) and of the daily GAMA excretion and GA-Val (lower panel) of 57 non-smoking omnivores and vegans (blue boxes), of 15 smoking omnivores and vegans (grey boxes), and of 16 raw food eaters (green boxes). Lines and boxes represent median values and the lower and upper quartiles, respectively, and the error bars represent the 10th and 90th percentiles. The significant differences are noted with asterisks (*p ≤ 0.05, **p ≤ 0.01, ***p ≤ 0.001, Mann–Whitney rank-sum test)
