Abstract
The global concern over water pollution caused by contaminants of emerging concern has been the subject of several studies due to the complexity of treatment. Here, the synthesis of a graphene oxide-based magnetic material (GO@Fe3O4) produced according to a modified Hummers’ method followed by a hydrothermal reaction was proposed; then, its application as a photocatalyst in clonazepam photo-Fenton degradation was investigated. Several characterization analyses were performed to analyze the structure, functionalization and magnetic properties of the composite. A 23 factorial design was used for the optimization procedure to investigate the effect of [H2O2], GO@Fe3O4 dose and pH on clonazepam degradation. Adsorption experiments demonstrated that GO@Fe3O4 could not adsorb clonazepam. Photo-Fenton kinetics showed that total degradation of clonazepam was achieved within 5 min, and the experimental data were better fitted to the PFO model. A comparative study of clonazepam degradation by different processes highlighted that the heterogeneous photo-Fenton process was more efficient than homogeneous processes. The radical scavenging test showed that was the main active free radical in the degradation reaction, followed by hydroxyl radicals (•OH) and holes (h+) in the valence layer; accordingly, a mechanism of degradation was proposed to describe the process.
Subject terms: Environmental sciences, Materials science, Nanoscience and technology
Introduction
In a global context, the pharmaceutical industry has emerged as an agent that facilitates human life, representing today one of the largest industrial branches on the planet. However, its growth in recent decades has not kept pace with the evolution of effluent treatment techniques1. Contaminants of emerging concern from the pharmaceutical industry, the so-called Pharmaceutical Active Components (PhACs), have drawn the attention of world organizations for representing a risk to human health and the environment, affecting the quality of water consumed by the population2. This is because PhACs are synthesized to produce a certain biological response in a target organism; however, they can also produce the same response when in contact with another organism. Additionally, several studies have reported the presence of PhACs in water bodies around the world, even in restricted regions, such as the Antarctic, where there is no permanent human population. PhACs have very stable and complex structures, low volatility and different hydrophobicities. In this manner, there is an urgent need for more specific and effective techniques for the removal of PhACs from these effluents3–7.
Conventional treatment methods are not effective at efficiently removing this class of contaminants. As a result, various tertiary treatment techniques have been proposed for the remediation of these contaminants5. Adsorption has been expensively studied as an alternative treatment for the removal of this class of compounds in aquatic environments. In this regard, a wide variety of materials have been employed as adsorbents. Many are classified by the authors as low-cost; others are classified as materials with high adsorptive capacity and selectivity. However, the need to determine a treatment method for the contaminant adsorbed on the material surface, or for a disposal procedure for the adsorbent at the end of its useful life, has raised the question of whether adsorption would be an effective treatment method or merely a phase change of contaminants8. Advanced oxidative processes (AOPs) have been proven to be an alternative with great potential for PhAC removal. These processes mainly involve the generation of radicals such as hydroxyl radicals (•OH) and sulfate radicals () via the use of sound, light, electricity, high temperature and pressure9,10. These radicals act as “weak points” in pollutant molecules (conjugated acids, double bonds, heteroatoms, etc.), effectively breaking the molecular structure of the contaminant and causing its subsequent degradation11.
Among the types of AOPs, the Fenton process is based on the Fe-catalyzed decomposition of H2O2 into •OH and stands out for its efficiency and low cost2,12, despite the generation of large amounts of sludge being considered a drawback. In heterogeneous Fenton reactions (Fenton-like reactions), a heterogeneous Fe catalyst is used to catalyze •OH production on the surface. In addition, when irradiated, the catalyst will generate electrons and holes (e− and h+) that can promote reduction and oxidation, respectively, and form new radicals. The heterogeneous Fenton process can be considered an alternative to the disadvantages of homogeneous processes because it is impossible to recover the catalyst and mitigate sludge production13. On the other hand, some of the e−/h+ pairs can recombine and reduce the process efficiency; additionally, the agglomeration of iron-based materials limits their efficiency14–16.
Graphene oxide (GO) has been applied as a carrier of metal oxides in AOP processes because of its good stability and high specific surface area. The oxygen-containing functional groups on the GO surface destroys the π bonds, reducing the ability of conducting electrons. In this sense, the reduction of GO to produces reduced graphene oxide (rGO) is a solution to repairs the electronic structure of the surface of GO. In this sense, GO and rGO can work as an electron acceptor, decreasing e−/h+ recombination and preventing the agglomeration of Fe nanoparticles, improving process performance16–19.
In the present work, the development of a graphene-based magnetic photocatalyst for the photo-Fenton degradation of clonazepam was proposed. GO was synthesized via the modified Hummers method. Subsequently, the material was functionalized to obtain GO@Fe3O4. A 23 factorial design was used to determine the influence of pH, [H2O2] and photocatalyst dosage on the process. Adsorption and photodegradation kinetics were performed, and based on these results, a mechanism was proposed. A comparative study was carried out to relate the efficiency of the process proposed in this work to the efficiency of homogeneous processes, adsorptive processes and other types of radiation sources for the degradation of the same contaminant under the same conditions.
Methodology
Basic contaminant information and bench UV-C reactor model
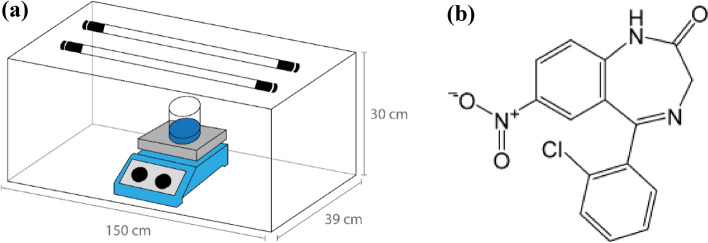
The experiment was performed using a bench reactor equipped with two UV‒C lamps (Philips, TUV model, 30 W 1SL/25) coupled to a magnetic stirrer where the Petri dishes were placed (Fig. 1a). Clonazepam (CZP) (Fig. 1b) [5-(2-chlorophenyl)-1, 3dihydro-7-nitro-2H-1,4-benzodiazepin-2-one] is a pharmaceutical from a benzodiazepine series with a molecular weight equal to 315.715 g mol−1, a pKa1 value of 1.50 and a pKa2 value of 10.5120,21.
Figure 1.
(a) Representative scheme of the photoreactor used in the tests; (b) Molecular formula of clonazepam.
Analytical method
The CZP concentration was measured using a high-performance liquid chromatography (HPLC) HP 1050 series Hewlett-Packard model equipped with a UV‒visible detector. Separation was performed on a Phenomenex Luna C18 (5 µm, 250 mm × 4.6 mm) column using methanol and distilled water (v/v = 70/30) as the mobile phase. The HPLC flow rate was 1 mL min−1, and the wavelength used was 254 nm.
Graphene oxide synthesis and functionalization
GO was synthesized following a top-down method according to modified Hummers’ method employed in previous works6,22. For this purpose, 1.0 g of graphite powder was mixed with 25.0 mL of H2SO4 in a flask in an ice bath at a temperature less than 15.0 °C for 10 min. Then, 3.0 g of KMnO4 was slowly added to the system. The ice bath was removed, and the mixture was agitated at 200 rpm for 6 h. After 6 h, the oxidation was stopped using 35.0 mL of H2O2 and 200.0 mL of distilled water. The graphite oxide was washed with 5% HCl and distilled water. Then, graphite oxide was sonicated in an ultrasonicator (Elma, 40 kHz, model EM30H) for 4 h to obtain graphene oxide23,24.
The graphene oxide was functionalized by co-precipitation of Fe3O4 nanoparticles in the presence of GO. For this purpose, a previous aqueous solution of 100.0 mL of FeCl3·6H2O and FeSO4.7H2O was prepared at a 3:1 molar ratio. The iron solution and the GO were mixed at a 3:1 weight ratio under constant stirring (250 rpm) at room temperature (25.0 ± 5.0 °C). Then, the temperature was increased to 60.0–70.0 °C, and the pH was adjusted to 11.0 using ammonium hydroxide. The system was then isolated from the outside environment, and the stirring was continued for 6 h. Diverse washes were carried out with ethanol and distilled water until the pH stabilized23,25.
Characterization of GO and GO@Fe3O4
Scanning electron microscopy (SEM) was used to analyze the surfaces of Fe3O4, GO and GO@Fe3O4 using a Tescan model Vega 3. Energy dispersive spectroscopy (EDS) was carried out with an Aztec Live spectrometer (Oxford) attached to the SEM equipment. All the samples were covered with gold under vacuum prior to SEM/EDS analysis.
Optical properties were measured by UV‒Vis diffuse reflectance spectroscopy (DRS) in the range of 200–800 nm. The analysis was performed with a Shimadzu 2700 model equipped with an ISR-2600 integrating sphere unit. The optical band-gap energy was measured following the Kubelka–Munk function, according to Eq. (1), and plotting [F(R) × hν]2 versus hν.
| 1 |
where R is the reflectance.
X-ray photoelectron spectroscopy (XPS) was performed on a ThermoScientific spectrometer (model Alpha, hυ = 1486.6 eV) to investigate the groups attached to the surface of the GO@Fe3O4. The XPS deconvolutions in the high-resolution were analyzed using the CasaXPS software with Gaussian (Y%)-Lorentzian (X%) profiles. The background from each spectrum was subtracted using Shirley-type background. The deconvolutions in the high-resolution spectrum were fitted with least chi-square value and an R2 value of 0.99.
From the results obtained by XPS analysis, a quantitative analysis of the surface elemental composition was performed using an empirical approach of the measured areas according to Eq. 226,27.
| 2 |
where Ai is the area under the corresponding core-level peak, and RSFi is the relative sensitivity factor.
Fourier-transformed infrared spectroscopy (FTIR) was used to determine the functional groups of Fe3O4 and GO@Fe3O4. For this purpose, an IR Prestige-21 spectrometer (Shimadzu) was used, and all the samples were subjected to infrared emission through attenuated total reflectance (ATR) crystal analysis.
The crystallographic structures of the nanocomposites were analyzed using X-ray diffraction (XRD). The analysis was performed with a D8 ADVANCE diffractometer (Bruker) equipped with a copper radiation source (λ = 1.5418 Å).
The pH of zero-point of charge (pHZPC) was determined by the salt addition method. For this purpose, 0.1 g of GO@Fe3O4 was mixed with 40.0 mL of NaCl for 24 h. The pH of the suspension was previously adjusted to an initial value of 2, 3, 4, 5, 6, 7, 8, 9, 10, 11 and 12 using HCl and NaOH 1.0 mol L−1 solutions and a Quimis pHmeter model Q400 as25.
The magnetization property of GO@Fe3O4 was investigated using a vibrating sample magnetometer (VSM), model Av 7 (Microsense).
23 Factorial design
To determine the ideal initial conditions, a 23 factorial design with a central point in triplicate was conducted. For this purpose, the mass of GO@Fe3O4, the initial pH of the solution and the concentration of hydrogen peroxide were investigated. The experiments were performed using 80.0 mL of a CZP solution with an initial concentration of 6.0 mg L−1. The values of the parameters were as follows: m[GO@Fe3O4]: 1 mg (−), 5.5 mg (0), and 10 mg (+); [H2O2]: 15.0 mg L−1 (−), 33.0 mg L−1 (0), 51.0 mg L−1 (+); pH: 3 (−), 6 (0), 9 (+). The choice of H2O2 concentration was based on a COD of 20.0 mg L−1 clonazepam solution. The combination of each parameter was realized following Table S1 (Supplementary Material), and the experiments were performed randomly to avoid unusual deviations associated with certain combinations of levels. The system was placed in a UV-C reactor for 15 min. The statistical analysis was performed using the software STATISTICA 12 and the “pure error” model.
Adsorption and photodegradation kinetics
The adsorption capacity of GO@Fe3O4 was investigated to determine, at the end of the process, the percentage of removal due to adsorption and photodegradation. For this purpose, the kinetics of adsorption were determined using 80.0 mL of a solution of CZP 6.0 mg L−1 of concentration. The experiment was performed without any source of radiation or H2O2. Therefore, 1 mg of GO@Fe3O4 was put in the system with the drug solution, and the final concentration was measured at the end of the following steps: 1, 3, 5, 7, 10, 13, 15, 20 and 30 min. The final concentration was measured by an HPLC-chromatographer, and the adsorptive capacity was calculated using Eq. (3).
| 3 |
where qt (mg g−1) is the adsorptive capacity; C0 and Cf are the initial and final concentrations of clonazepam (mg L−1), respectively; V is the volume of contaminant solution (L); and m is the dosage of the material (g).
After the adsorption kinetic, the time of equilibrium was identified and before the photodegradation kinetic, the photocatalyst was mixed with 80.0 mL of a solution of clonazepam (6.0 mg L−1) without radiation for a time equal to the time of equilibrium. Then, the concentration was measured and considered as the initial concentration for photodegradation kinetic. Then, H2O2 was added to the system at a concentration of 15.0 mg L−1 and the UV-C reactor was turned on. The kinetics were determined according to the adsorption kinetic, and at the end, the final concentration was measured via an HPLC-chromatographer. The data were fitted for the PFO model proposed by28 (Eq. (4)), PSO (Eq. (5)) and Chan & Chu model (Eq. (6)). All experiments were conducted in duplicate.
| 4 |
| 5 |
| 6 |
In which C0 (mg L−1) is the initial concentration of the clonazepam solution; Ct (mg L−1) is the concentration of clonazepam solution at time t; k1 (min−1) is the apparent first-order rate constant; k2 (L mg−1 min−1) is the apparent second-order rate constant; t (min) is the time; 1/ρ (min−1) is the initial removal rate of clonazepam; and 1/σ (dimensionless) is the maximum oxidative capacity in the process.
Comparison of different processes in clonazepam degradation and radical scavenging tests
The efficiency of the photo-Fenton reaction with GO@Fe3O4 under UV-C radiation was compared with that of other processes, including homogeneous processes; for not necessarily, a photocatalyst is sometimes less expensive than a heterogeneous process. In addition, other radiation sources, such as UV-A (Taschibra TF40T-811y, 120.0 cm, 40 W, 1.72 W m−2) and LED (Black-Decker BDT8-0900, 87.0 cm, 10.0 W, 15.60 W m−2 at 550 nm), were tested. The experiment was carried out under identical experimental conditions (pH 3.0; T = 25.0 °C; GO and GO@Fe3O4 dosage = 1 mg; [H2O2] = 15.0 mg L−1) for 10 min.
The radical scavenging test was evaluated to obtain information about the degradation mechanism. For this purpose, benzoquinone (BZQ), formic acid (FA) and methanol were used to trap superoxide radical anions (), holes (h+) and hydroxyl radicals (•OH), respectively. The experimental conditions were the same as those used in the kinetic study, and the concentration of the scavenger was 0.1 M.
Results and discussion
Characterization of GO and GO@Fe3O4
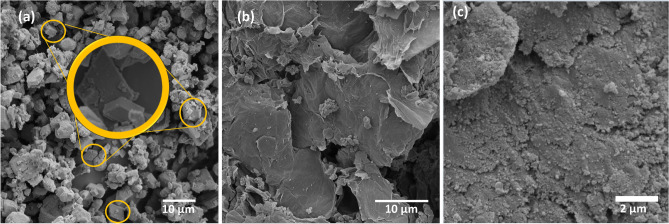
Scanning electron microscopy (SEM) analysis was performed to assess the morphology of the materials. Figure 2a shows an SEM image of the Fe3O4 nanoparticles, where it is possible to observe small particles (< 5 µm) with a tendency toward octahedral morphology, which is attributed to the use of NH4OH. Previous works have shown the influence of the NH4OH concentration on the morphology and magnetic properties of magnetite29. However, their heterogeneity may be due to the use of concentrated NH4OH. A study conducted by Perez et al. (2020) showed that more heterogeneous conditions in terms of shape and size of Fe3O4 particles were obtained when concentrated NH4OH was used. On the other hand, more homogeneous shapes were obtained when NH4OH was used in conjunction with NaNO329. Figure 2a also shows the agglomeration of the particles that occurs due to their strong anisotropic dipolar interactions30.
Figure 2.
SEM images of Fe3O4 (a), GO (b) and GO@Fe3O4 (c).
Figure 2c shows the surface morphology of GO@Fe3O4, in which a rough and wrinkled agglomerations resembling a spongier structure could be observed; these agglomerations were not observed on the GO surface (Fig. 2b). GO exhibits compacted and wrinkled layered, clean sheets. This roughness could be attributed to the presence of small Fe3O4 nanoparticles attached to the GO surface31–33.
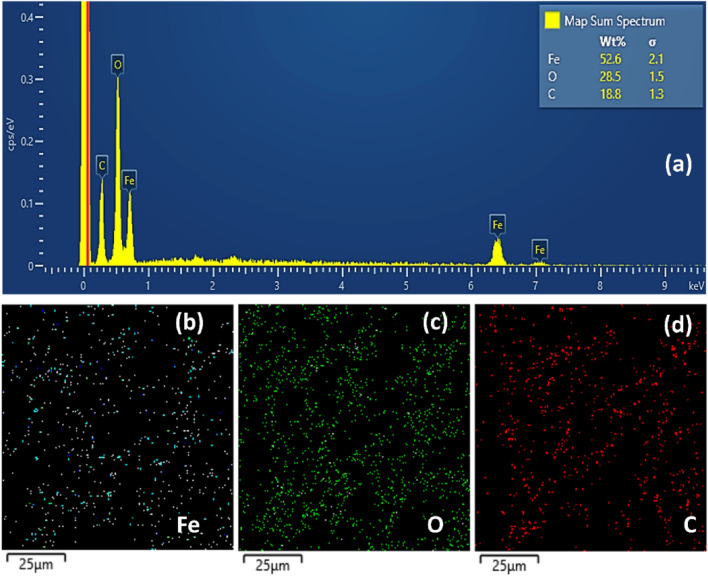
The elemental composition was estimated by EDS (Fig. 3a), which indicates Fe (53 wt%), O (28 wt%) and C (19 wt%). The images also show the homogeneous dispersion of Fe on the photocatalyst surface (Fig. 3b) within the analyzed area. Furthermore, carbon and oxygen (Fig. 3d and Fig. 3c) are also dispersed, as expected due to the GO sheets.
Figure 3.
Energy dispersive X-ray pattern of GO@Fe3O4 (a), (b–d) elemental mapping of O, Fe and C elements.
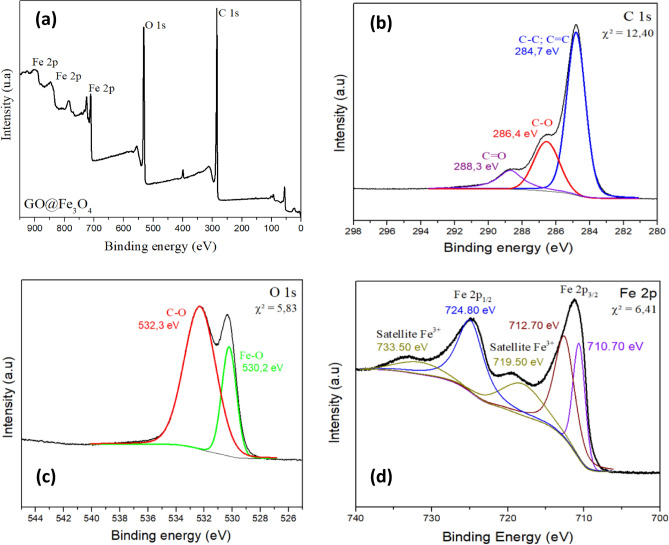
The surface chemical properties of GO@Fe3O4 were investigated via XPS analysis (Fig. 4). The spectra for GO@Fe3O4 (Fig. 4a) exhibited peaks at the ranges of 250–300 eV and 520–540 eV attributed to C 1 s and O 1 s, respectively. The peaks at the range 710–730 eV, 845 and 900 eV are attributed to the presence of Fe. These results again confirm the purity of the nanomaterial studied in this paper. The high-resolution C 1s spectrum (Fig. 4b) shows peaks at 284.70, 286.40 and 288.30 eV attributed to the presence of non-oxygenated carbon (C–C and C=C), corresponds to sp2 C–C in the aromatic ring, epoxy (C–O) and carbonyl (C=O) groups, respectively. Figure 4b also reveals the highly oxidized state of GO. The O 1 s spectrum (Fig. 4c) can be deconvoluted into two peaks, which were at 530.20 eV, corresponding to Fe–O, and a peak at 532.30 eV attributed to C–O. Another point to note is the absence of a peak corresponding to the Fe–O–C bond in the O 1 s spectrum. The presence of this peak is characteristic of the interaction between magnetite and the oxygenated functional groups present on the surface of graphene oxide. When magnetite is bound to oxygenated groups, this interaction results in a change in the bonding characteristics of the Fe atoms, leading to the formation of the Fe–O–C bond34. Moreover, the Fe 2p individual spectrum (Fig. 4d) exhibited peaks at 710.70 eV and 724.80 eV attributed to Fe2+ and Fe3+ in octahedral sites, respectively, while the peak at 712.70 eV was attributed to Fe3+ in tetrahedral sites. These results indicate the presence of Fe3O4 on the GO surface. Moreover, the satellite peaks at 719.50 and 733.50 eV are attributed to the presence of the Fe3+ oxidation state on GO@Fe3O435–39. These results are in agreement with what is reported in the literature40.
Figure 4.
XPS spectra of GO@Fe3O4 (a), C 1 s (b), O 1 s (c) and Fe 2p (d).
The results of the quantitative analysis calculated according to Eq. 2 are presented in Table S2. Analyzing the results from Table S2, it is observed that there is a predominance of iron on the material surface, since the results reported by XPS are representative only of the surface layer of the nanomaterial. Another point to be noted is the difference between the results presented in Table S2, concerning the quantitative analysis of the elements by XPS, and the results obtained by EDS (Fig. 3a). This happens because XPS is an analysis with much lower penetration power than EDS analysis.
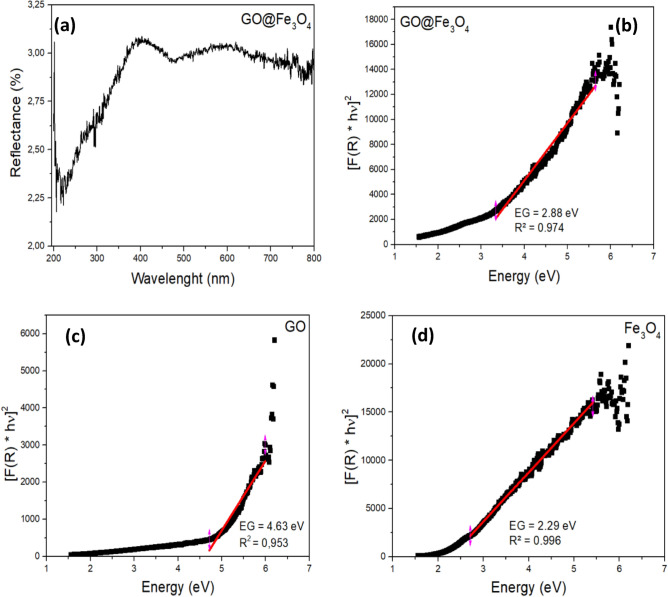
Figure 5a shows that the material exhibits low reflectance in the UV range, indicating that GO@Fe3O4 has better photocatalytic activity in this UV region. The band gap energy calculated by the Kubelka–Munk function for GO@Fe3O4 (Fig. 5b) was found to be 2.88 eV. By comparing these results to the band gap energy for GO (Fig. 5c) and Fe3O4 (Fig. 5d), it is possible to conclude that the presence of Fe3O4 leads to narrowing of the band gap in GO. Additionally, it can be speculated that GO@Fe3O4 may exhibit better photocatalytic activation than its precursors. A low band gap improves the absorption of radiation and, consequently, improves the transfer of electrons from the valence band to the conductive band. Although GO@Fe3O4 had a greater band gap than its precursor Fe3O4, the difference was very small. Additionally, GO serves as an acceptor and transporter of electrons, avoiding the recombination of e−/h+41–44.
Figure 5.
UV‒Vis DRS spectra of GO@Fe3O4 (a), UV‒Vis DRS spectra and Kulbelka–Munk plot [F(R) × hν]2 versus hν of GO@Fe3O4 (b), GO (c) and Fe3O4 (d).
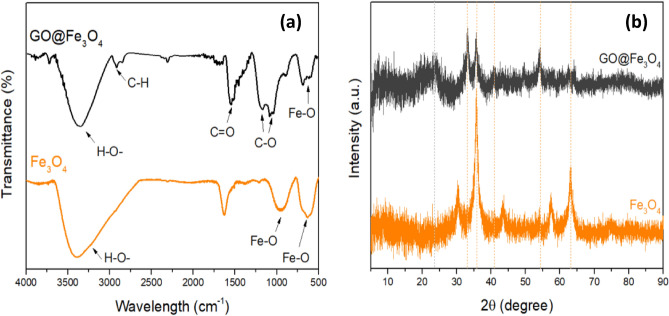
The FTIR spectra of Fe3O4 and GO@Fe3O4 are shown in Fig. 6a where it is possible to observe characteristic peaks of Fe3O4 in the GO@Fe3O4 spectra. The peaks at 634.76 and 959.56 cm−1 in the Fe3O4 sample and 590.85 cm−1 in the GO@Fe3O4 spectra is referent to the stretching vibration of the Fe–O bond31,45. The band at 1547.80 cm−1 in the GO@Fe3O4 spectrum is attributed to carbonyl groups (–C=O), and the peaks at 1187.43 and 1069.33 cm−1 are attributed to the C–O stretching vibrations attributed to the presence of alkoxy and epoxy groups, respectively. The peak at 1629 cm−1. The peak at 86 cm−1 in the Fe3O4 spectra is attributed to the bending vibration of the absorbed water. The broad band at 3392.81 cm−1 present in the GO@Fe3O4 and Fe3O4 spectra are attributed to the stretching of H–O bonds of hydroxyl groups46,47.
Figure 6.
FTIR spectra (a) and XRD patterns of Fe3O4 and GO@Fe3O4 (b).
The XRD patterns of GO@Fe3O4 and Fe3O4 are compared in Fig. 6b, in which it is possible to see that the synthesized material exhibits characteristic Fe3O4 peaks. The broad peak at ~ 2θ 23° (002) for GO@Fe3O4 is attributed to the partial reduction of GO caused by the co-precipitation reaction of iron ions, strongly alkaline conditions of synthesis, and sample preparation, which requires high temperatures48,49. The broad peak at ~ 2θ 23° (002) for GO@Fe3O4 and the absence of the peak at ~ 2θ 10–11° found in GO diffractograms is a characteristic attributed to the partial reduction of GO caused by the co-precipitation reaction of iron ions, strongly alkaline synthesis conditions, and sample preparation, which requires high temperatures. Similar results have been reported by Chai et al. (2020) and Neolaka et al. (2020), and both studies concluded that the reduction occurred due to the synthesis conditions50,51.
The peaks at 2θ 30° (220), 35° (311), 40° (400), 54° (422), 57° (511) and 63° (440) present in the GO@Fe3O4 and Fe3O4 spectra are characteristic of Fe3O4 nanoparticles with a face-centered cubic lattice. The decrease in the intensity of the peaks is attributed to the combination with GO (JCPDS No. 19-0629)32,41,42,47,48,52,53.
Figure S1 shows that the material has a zero-point charge of 7.5. The zero-point charge was determined to understand the adsorption and photocatalytic processes since the pH affects the interaction between the material and the target. When the pH < pHZPC, the GO@Fe3O4 surface is positively charged; and when the pH > pHZPC the surface is negatively charged25.
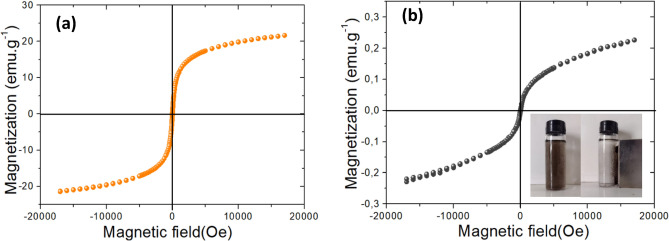
Figure 7 shows the magnetization hysteresis curves of Fe3O4 and GO@Fe3O4 measured at room temperature, where it can be concluded that the nanocomposite has superparamagnetic properties. This is attributed to the absence of hysteresis and coercivity. In addition, the saturation magnetization for GO@Fe3O4 and Fe3O4 are 0.22 emu g−1 and 21 emu g−1, respectively. The decrease in the saturation magnetization is attributed to the presence of non-magnetic GO, but although the nanocomposite has less saturation magnetization, it was easy to separate the material using a magnetic field, as shown in Fig. 7b53,54.
Figure 7.
Magnetization hysteresis curves of Fe3O4 (a) and GO@Fe3O4 (b) at room temperature.
23 Factorial design
A 23 factorial design with a central point in triplicate was performed to evaluate the ideal experimental conditions. By analyzing the table of effect estimates (Table S3), it is possible to see that pH was the only parameter significant for the degradation process, with a p-level lower than 5.0% and a 95.0% of confidence interval. Additionally, the effect was negative, indicating that at pH 3, the best results were achieved. This can be explained by the photolytic decomposition of H2O2 to H2O and O2, which, is sevenfold greater in basic media than in acid media, and three times greater in neutral media55,56.
In addition, these results could be due to the rapid and easy degradation of clonazepam compared with that of other contaminants treated via similar processes12,57. Additionally, an increase in the dosage of the nanomaterial leads to an increase in turbidity, which results in a decrease in light transmission and GO@Fe3O4 activation. Moreover, at high levels, H2O2 can act as an •OH scavenger, which results in a decrease in the efficiency of the process.
The mathematical model that describes the degradation of clonazepam, which contains significant effects with a 95.0% confidence level in the domain of experimental design, is shown in Eq. (7).
| 7 |
where y represents the percentage of clonazepam degradation and x1 is the pH. The domain of x1 is {x ϵ R/ − 1 ≤ x ≤ 1}. The data presented in the ANOVA table (Table S4, supplementary material) showed that there was no evidence of a lack of adjustment for a 95% confidence level because the LFMS/PEMS ratio was lower than the tabulated F1,8 (5.32, p-level 0.05). Additionally, the statistical significance of the regression was confirmed because the MSR/MSr ratio was greater than the tabulated F1,9 (5.12, p-level 0.05).
These results are confirmed by the surface response (Fig. S2), where it is possible to see that the zone with a higher percentage of degradation is associated with a lower pH. Furthermore, for a fixed pH, the percentage of degradation did not significantly increase when the other associated parameters changed from − 1 to + 1.
Due to the results achieved in the factorial design/surface response analysis, the variable values chosen in the following experiments were 1.0 mg of GO@Fe3O4, 15.0 mg L−1 [H2O2] with a solution of clonazepam at a pH of 3.
Adsorption and photodegradation kinetics
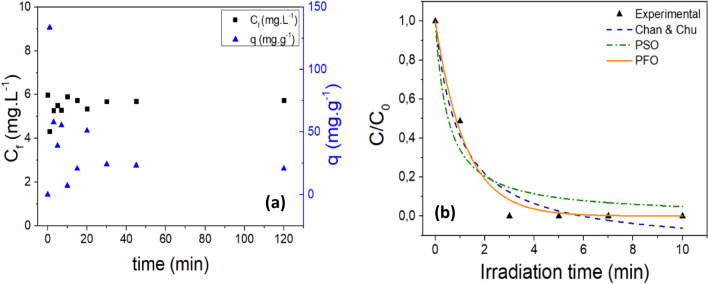
An adsorption kinetic experiment was conducted to understand and quantify the percentage of CZP removal attributed to the adsorption and photocatalysis processes. Figure 8a and Table S5 (Supplementary Material) depict the results obtained for the adsorption kinetics. The data clearly show that GO@Fe3O4 was not efficient to fully adsorbing clonazepam molecules. After 1 min of adsorption, the adsorptive capacity reached its peak, indicating faster adsorption of clonazepam; however, this value decreased over the course of the experiment, indicating desorption process. This can be explained considering the pKa of clonazepam, the pHPZC and the medium pH. At pH 3, the surface of GO@Fe3O4 is positively charged, and as an amphoteric compound that has two dissociation constants, CZP mainly exists in its neutral form since pKa1 < pH < pKa2. Therefore, nonelectrostatic interactions occur under these conditions21.
Figure 8.
Plot of final concentration of clonazepam and adsorptive capacity evaluation versus irradiation time for the adsorption process (a) and photodegradation of clonazepam versus irradiation time ([H2O2] = 15 mg L−1; mOG@Fe3O4 = 1.0 mg; pH 3; assisted by UV-C radiation) (b).
Another factor that may have influenced the non-adsorption of clonazepam by GO@Fe3O4 relates to the GO/Fe ratio of the nanomaterial. Since the material contains much more iron than GO, this may have hindered the pollutant adsorption. In the literature, studies can be found where clonazepam was treated by adsorption using material similar to that studied in this work. However, small modifications in synthesis can lead to significant changes in treatment processes58. The study conducted by Nascimento et al. (2022) investigated the adsorption of clonazepam by graphene oxide functionalized with iron oxide at a GO/Fe ratio of 1:1. As a result, the authors achieved rapid pollutant adsorption and an adsorption coefficient of 12.326 for the PFO kinetic model21.
Figure 8b and Table S6 (Supplementary Material) show the results obtained from the photodegradation kinetic where it is possible to observe that the clonazepam was completely degraded after 5 min. In addition, the HPLC data did not show any other peak, indicating the complete degradation of clonazepam without the formation of any intermediate. Table 1 presents the kinetic parameters, from which it is possible to see that the PFO model better fit the experimental data with a kinetic rate of 0.83 min−1.
Table 1.
Kinetic parameters for the photodegradation process assisted by UV-C radiation.
| Model | Parameter | Statistical parameters | ||
|---|---|---|---|---|
| PFO | k1 (min−1) | R2 | χ2 | |
| 0.83 ± 0.09 | 0.99 | 0.002 | ||
| PSO | k2 (L mg−1 min−1) | R2 | χ2 | |
| 1.94 ± 0.75 | 0.93 | 0.012 | ||
| Chan & Chu | 1/ρ (min−1) | σ | R2 | χ2 |
| 1.19 | 1.17 | 0.96 | 0.006 | |
Studies evaluating the degradation of clonazepam are rare; however, it is possible to find works that studied the degradation of pharmaceuticals by similar photocatalysts. Table S7 shows a comparison study of several photocatalysts for the degradation of pharmaceuticals.
Table S7 shows that similar materials were used as photocatalysts for the degradation of different PhACs. The removal percentage was greater than 90.0% for all the reported studies. However, it is well known that the concentration of PhACs in waterbodies is in the range of µg-ng L−12,58,59, therefore, it is important to assess the efficiency at which total degradation can be achieved. Table S7 shows that none of these studies achieved 100% degradation, and in some of those studies, the initial and final concentrations were so high that they deviated from real environmental conditions. The efficiency of the process can be improved by the addition of H2O2 and the use of some radiation source, promoting the formation of radicals. This was not considered in these previous reports.
Comparison of different processes in clonazepam degradation and radical scavenging tests
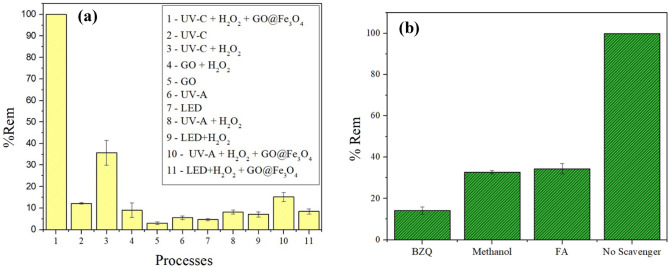
The removal efficiency of clonazepam by various processes was studied under identical experimental conditions for 10 min. Figure 9a shows that, compared with other treatment processes, the heterogeneous photo-Fenton process under UV-C radiation results in the highest percentage of clonazepam degradation. Photoperoxidation presented the second-best result (35.73%). These results can be explained by the lower oxidation potential of H2O2 (1.77 V) compared with the oxidation potential of •OH (2.80 V) and HO2• radicals that were generated by the decomposition of H2O2 under UV-C radiation. Additionally, in the presence of a photocatalyst, other reactions occur, and the generation of radical species is improved, as shown in Eqs. (9) to (11)49,60.
Figure 9.
The removal efficiency of clonazepam by different processes (a) and scavenging tests (b) (pH 3.0; GO and GO@Fe3O4 dosage = 1.0 mg; [H2O2] = 15.0 mg L−1 and T = 25.0 °C).
A reuse test of GO@Fe3O4 was conducted, where at the end of the process, the material was recovered and used again in a new process. The results are presented in Figure S3. Analyzing the results in Figure S3, it can be seen that the material was able to degrade the contaminant under the studied conditions even after 5 reuse cycles. SEM and EDS characterization analyses were conducted to examine the material after the process. The results presented in Figures S4 and S5, respectively, showed good stability of the material even after its use. This is seen in the EDS analysis results, where the characteristics found in the material before its use are maintained after the reuse test. Additionally, a small amount of Cl was found. This is justified by the presence of Cl in clonazepam. The Au found in the EDS analysis is due to the sample preparation for the analysis. Furthermore, the SEM images showed the same roughness found in Fig. 2c, referring to the presence of iron oxide on the GO surface.
Moreover, different radiation sources did not result in a high percentage of clonazepam removal, which can be explained by the very efficient source of •OH for each molecule of H2O2 when irradiated at 254 nm61. The UV‒Vis DRS (Fig. 5) spectrum also confirmed the high absorption of radiation in the UV-C range, which resulted in the formation of other radical species. H2O2 under UV-C radiation produces hydroxyl radicals according to Eq. (8). The degradation observed for the system composed of GO and H2O2 (5.69%) is attributed to the capacity of GO to act as a catalyst and react with H2O2 to generate •OH62.
| 8 |
The degradation of clonazepam under UV-C without the presence of a catalyst and H2O2 (process number 2), less than 15% shows that although the pharmaceutical was resistant to photolysis, the molecule can absorb UV radiation and decompose63.
The radicals scavenging test (Fig. 9b) was performed using benzoquinone (BZQ), methanol and formic acid (FA) to quench superoxide radical ions (), hydroxyl radical (•OH) and holes (h+), respectively. The graph shows the efficiency decrease in the presence of the scavengers. In addition, was the main active free radical in the degradation reaction, followed by •OH and h+. Similar results were obtained by Bashiri and coworkers for the degradation of metronidazole using Fe3O4/rGO/TiO264.
In photo-Fenton reaction, •OH is produced by hydrogen peroxide decomposition under a radiation source and catalyzed by ferrous iron, as shown in Eqs. (9) and (10)23,65,66.
| 9 |
| 10 |
The use of some radiation sources also enhances the formation of •OH and the degradation efficiency by the decomposition of complexes that are formed during the conventional reactions, as shown in Eq. (11)66.
| 11 |
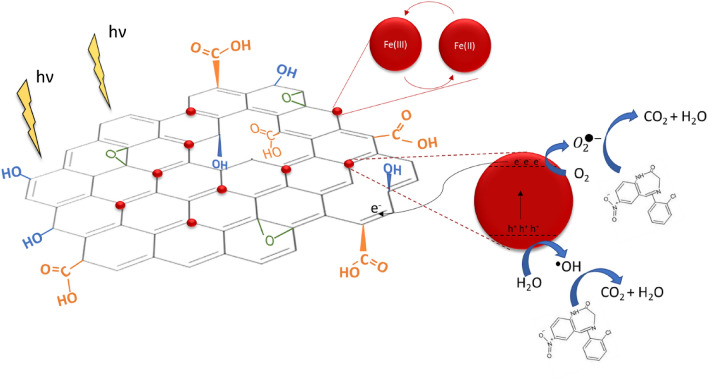
In the homogeneous process, iron ions are consumed, resulting in poor recycling and the formation of iron sludge18,60,67. In the heterogeneous photo-Fenton process proposed in this study, the presence of GO helps to accelerate the cycling of Fe(II) and Fe(III) in addition to preventing the aggregation of Fe3O4 nanoparticles18,67.
Thus, the mechanism of degradation occurs with the Fenton reaction and the recycling of Fe(III)/Fe (II) as shown in Eqs. (9) and (10). In addition, the Fe3O4 nanoparticles anchored in GO could be activated to produce electron and hole pairs. These electrons are transferred to the GO surface, where they hider the recombination of electrons and holes and react with Fe(III) to form Fe(II), which can further react with H2O2 to form •OH and Fe(III). Moreover, the electron can reduce O2 to , as shown in Eq. (12). •OH and attack clonazepam molecules until total mineralization. The holes can degrade clonazepam through a direct oxidation mechanism, as described in Eq. (13)18,67,68.
| 12 |
| 13 |
Figure 10 shows a schematic illustration of the proposed mechanism for clonazepam degradation by GO@Fe3O4 via the photo-Fenton reaction.
Figure 10.
Schematic illustration of clonazepam degradation by GO@Fe3O4 under UV-C radiation, where  represents the Fe3O4 on the GO basal plane.
Conclusions
The synthesized graphene oxide-based magnetic photocatalyst exhibited excellent performance for the treatment of water contaminated with clonazepam. Characterization analyses demonstrated the successful functionalization of GO@Fe3O4. The SEM images comparing the surface morphologies of GO, Fe3O4 and GO@Fe3O4 show rough compaction on GO@Fe3O4, which is evidence of the presence of Fe3O4 on the GO surface. The SEM image of Fe3O4 shows octahedral heterogeneous structures attributed to the agglomeration of the particles. The EDS results confirmed the presence of Fe in the composite sample. UV‒Vis DRS spectra show that the material exhibits better radiation absorption in the UV region. Furthermore, the bandgap was 2.88 eV. Although GO enhances the Fe3O4 bandgap, its presence in photocatalysts is important because GO acts as an electron acceptor and transporter, prevents h+/e− recombination and enhances photocatalyst properties. The FTIR spectrum of GO@Fe3O4 shows a band at 590.85 cm−1 attributed to the stretching vibration of Fe–O, confirming the presence of iron oxide in GO. The XRD patterns of GO@Fe3O4 show peaks from both precursor materials, confirming that functionalization was successful. A 23 factorial design showed that pH was the only factor that significantly affected clonazepam degradation. The adsorption study showed that GO@Fe3O4 does not adsorb the contaminant. In addition, the photodegradation kinetic showed the complete degradation of a clonazepam solution in 5 min, and the model that better fitted to the experimental data was PFO, for which the kinetic constant was 0.83 min−1. The reuse test showed that the material maintains its photocatalytic capacity even after 5 cycles. Furthermore, SEM and EDS analyses conducted after the AOP process showed good stability of the nanomaterial. The heterogeneous photo-Fenton process had the best efficiency when compared to other processes. The proposed mechanism involves the formation of electron and hole pairs by the photoactivation of Fe3O4 anchored on GO and the transfer of electrons to the GO surface. The generation of •OH occurs by the capture of electrons by H2O2. Moreover, the electron can react with Fe(III) to form Fe(II), which can further react with H2O2 to form •OH. The presence of a UV-C irradiation source also improved the formation of •OH. •OH degrades clonazepam to form CO2 and H2O.
Supplementary Information
Acknowledgements
The authors acknowledge the technical support provided by the Laboratory of Characterization of Materials at UACSA, Federal Rural University of Pernambuco (UFRPE); the Laboratory of Industrial Chromatography (LCI) at the Department of Chemical Engineering, Federal University of Pernambuco (UFPE); and by the Biomass characterization laboratory, Analytical and Calibration Resources (LRAC) at the Faculty of Chemical Engineering, State University of Campinas.
Abbreviations
- AOP
Advanced oxidative processes
- CZP
Clonazepam
- GO
Graphene oxide
- GO@Fe3O4
Magnetic graphene oxide
- HPLC
High-performance liquid chromatography
- PFO
Pseudo-first order
- PSO
Pseudo-second order
- PhACs
Pharmaceuticals active components
Author contributions
M.P. da Silva: Conceptualization, Investigation, Visualization, Analysis, Data curation, Writing—Original Draft; A.C.A. de Souza: Investigation, Data curation, Analysis; A.R.D. Ferreira: Investigation, Data curation, Analysis; P.L.A. do Nascimento: Investigation, Data curation, Analysis; T.J.M. Fraga: Conceptualization, Supervision, Methodology, Writing—Review; J.V.F.L. Cavalcanti: Supervision, Data curation; M.G. Ghislandi: Supervision, Methodology, Writing—Review; M.A. da Motta Sobrinho: Conceptualization, Resources, Project Administration.
Funding
This work was funded by Fundação de Amparo à Ciência e Tecnologia do Estado de Pernambuco (FACEPE) [Grant Numbers BIC-0863-3.06/21 and APQ-1086-3.06/15], the Conselho Nacional de Desenvolvimento Científico e Tecnológico (CNPq) [Grant Number 150734/2020-4] and the Coordenação de Aperfeiçoamento de Pessoas de Nível Superior (CAPES) [Grant Number 88887.616594/2021-00].
Data availability
All the data generated during this study are included in this published article and its Supplementary Information files.
Competing interests
The authors declare no competing interests.
Footnotes
Publisher's note
Springer Nature remains neutral with regard to jurisdictional claims in published maps and institutional affiliations.
Supplementary Information
The online version contains supplementary material available at 10.1038/s41598-024-67352-8.
References
- 1.Yan, B. et al. Adsorptive removal of diclofenac by graphene oxide: Optimization, equilibrium, kinetic and thermodynamic studies. J. Taiwan Inst. Chem. Eng.98, 150–162 (2019). 10.1016/j.jtice.2018.07.034 [DOI] [Google Scholar]
- 2.Sbardella, L. et al. Integrated assessment of sulfate-based AOPs for pharmaceutical active compound removal from wastewater. J. Clean. Prod.260, 121014 (2020). 10.1016/j.jclepro.2020.121014 [DOI] [Google Scholar]
- 3.Santos, A. V. et al. Occurrence and risk assessment of pharmaceutically active compounds in water supply systems in Brazil. Sci. Total Environ.746, 141011 (2020). 10.1016/j.scitotenv.2020.141011 [DOI] [PubMed] [Google Scholar]
- 4.Hernández, F. et al. Occurrence of antibiotics and bacterial resistance in wastewater and sea water from the Antarctic. J. Hazard. Mater.363, 447–456 (2019). 10.1016/j.jhazmat.2018.07.027 [DOI] [PubMed] [Google Scholar]
- 5.Neha, R. et al. Nano-adsorbents an effective candidate for removal of toxic pharmaceutical compounds from aqueous environment: A critical review on emerging trends. Chemosphere.272, (2021). [DOI] [PubMed]
- 6.Postigo, C., Moreno-Merino, L., López-García, E., López-Martínez, J. & López de Alda, M. Human footprint on the water quality from the northern Antarctic Peninsula region. J. Hazard. Mater.453, 131394 (2023). 10.1016/j.jhazmat.2023.131394 [DOI] [PubMed] [Google Scholar]
- 7.Hawash, H. B. et al. Occurrence and spatial distribution of pharmaceuticals and personal care products (PPCPs) in the aquatic environment, their characteristics, and adopted legislations. J. Water Process Eng.52, 103490. 10.1016/j.jwpe.2023.103490 (2023). 10.1016/j.jwpe.2023.103490 [DOI] [Google Scholar]
- 8.Alessandretti, I., Rigueto, C. V. T., Nazari, M. T., Rosseto, M. & Dettmer, A. Removal of diclofenac from wastewater: A comprehensive review of detection, characteristics and tertiary treatment techniques. J. Environ. Chem. Eng.9, 106743. 10.1016/j.jece.2021.106743 (2021). 10.1016/j.jece.2021.106743 [DOI] [Google Scholar]
- 9.Wang, B. & Wang, Y. A comprehensive review on persulfate activation treatment of wastewater. Sci. Total Environ.831, 154906. 10.1016/j.scitotenv.2022.154906 (2022). 10.1016/j.scitotenv.2022.154906 [DOI] [PubMed] [Google Scholar]
- 10.Giannakis, S., Lin, K. Y. A. & Ghanbari, F. A review of the recent advances on the treatment of industrial wastewaters by Sulfate Radical-based Advanced Oxidation Processes (SR-AOPs). Chem. Eng. J.406, 127083. 10.1016/j.cej.2020.127083 (2021). 10.1016/j.cej.2020.127083 [DOI] [Google Scholar]
- 11.Li, S. et al. Antibiotics degradation by advanced oxidation process (AOPs): Recent advances in ecotoxicity and antibiotic-resistance genes induction of degradation products. Chemosphere311, 139977. 10.1016/j.chemosphere.2022.136977 (2023). 10.1016/j.chemosphere.2022.136977 [DOI] [PubMed] [Google Scholar]
- 12.da Silva, M. P. et al. Adsorptive and photocatalytic activity of Fe3O4-functionalized multilayer graphene oxide in the treatment of industrial textile wastewater. Environ. Sci. Pollut. Res.10.1007/s11356-020-10926-6 (2020). 10.1007/s11356-020-10926-6 [DOI] [PubMed] [Google Scholar]
- 13.Mu, L. et al. Boosting Photo-Fenton reactions by amidoxime chelated ferrous iron (Fe(III)) catalyst for highly efficient pollutant control. Appl. Catal. B298, 120574 (2021). 10.1016/j.apcatb.2021.120574 [DOI] [Google Scholar]
- 14.Ribeiro, J. P. & Nunes, M. I. Recent trends and developments in Fenton processes for industrial wastewater treatment - A critical review. Environmental Research197, (2021). [DOI] [PubMed]
- 15.Ma D. et al. Critical review of advanced oxidation processes in organic wastewater treatment. Chemosphere275, (2021). [DOI] [PubMed]
- 16.Guo, H. et al. Accelerated Fenton reaction for antibiotic ofloxacin degradation in discharge plasma system based on graphene-Fe3O4 nanocomposites. Vacuum185, 110022 (2021). 10.1016/j.vacuum.2020.110022 [DOI] [Google Scholar]
- 17.Song, S. et al. Ultrasmall graphene oxide modified with Fe3O4 nanoparticles as a Fenton-like agent for methylene blue degradation. ACS Appl. Nano Mater.2, 7074–7084 (2019). 10.1021/acsanm.9b01608 [DOI] [Google Scholar]
- 18.Wang, F. et al. Facile self-assembly synthesis of Γ-Fe2O3/graphene oxide for enhanced photo-Fenton reaction. Environ. Pollut.248, 229–237 (2019). 10.1016/j.envpol.2019.01.018 [DOI] [PubMed] [Google Scholar]
- 19.Feng, Y. et al. Research progress of graphene oxide-based magnetic composites in adsorption and photocatalytic degradation of pollutants: A review. Mater. Res. Bull.162, 112207. 10.1016/j.materresbull.2023.112207 (2023). 10.1016/j.materresbull.2023.112207 [DOI] [Google Scholar]
- 20.Habibi, B. & Jahanbakhshi, M. Silver nanoparticles/multi walled carbon nanotubes nanocomposite modified electrode: Voltammetric determination of clonazepam. Electrochim. Acta118, 10–17 (2014). 10.1016/j.electacta.2013.11.169 [DOI] [Google Scholar]
- 21.Nascimento, B. F. et al. Synthesis and application of ferromagnetic graphene oxide nanocomposite as an effective adsorbent for Clonazepam: Batch experiments, modeling, regeneration, and phytotoxicity. J. Environ. Chem. Eng.10, 108331 (2022). 10.1016/j.jece.2022.108331 [DOI] [Google Scholar]
- 22.Fraga, T. J. M. et al. Amino-Fe3O4-functionalized graphene oxide as a novel adsorbent of Methylene Blue: Kinetics, equilibrium, and recyclability aspects. Environ. Sci. Pollut. Res.26, 28593–28602 (2019). 10.1007/s11356-018-3139-z [DOI] [PubMed] [Google Scholar]
- 23.Hummers, W. S. & Offeman, R. E. Preparation of graphitic oxide. J. Am. Chem. Soc.80, 1339 (1958). 10.1021/ja01539a017 [DOI] [Google Scholar]
- 24.Chai, P. V., Mahmoudi, E., Teow, Y. H. & Mohammad, A. W. Preparation of novel polysulfone-Fe3O4/GO mixed-matrix membrane for humic acid rejection. J. Water Process Eng.15, 83–88 (2017). 10.1016/j.jwpe.2016.06.001 [DOI] [Google Scholar]
- 25.Mahmood, T. et al. Comparison of different methods for the point of zero charge determination of NiO. Ind. Eng. Chem. Res.50, 10017–10023 (2011). 10.1021/ie200271d [DOI] [Google Scholar]
- 26.Shard, A. G. Practical guides for x-ray photoelectron spectroscopy: Quantitative XPS. J. Vac. Sci. Technol. A Vac. Surf. Film38, 031204 (2020). [Google Scholar]
- 27.Greczynski, G. & Hultman, L. X-ray photoelectron spectroscopy: Towards reliable binding energy referencing. Prog. Mater. Sci.107, 100591. 10.1016/j.pmatsci.2019.100591 (2020). 10.1016/j.pmatsci.2019.100591 [DOI] [Google Scholar]
- 28.He, Y., Sutton, N. B., Rijnaarts, H. H. M. & Langenhoff, A. A. M. Corrigendum to ‘Degradation of pharmaceuticals in wastewater using immobilized TiO2 photocatalysis under simulated solar irradiation’ [Appl. Catal. B: Environ. 182 (2016) 132-141]. Appl. Catal. B189, 283 (2016). 10.1016/j.apcatb.2016.02.027 [DOI] [Google Scholar]
- 29.Perez, G. et al. Alkali concentration effects on the composition, morphology and magnetic properties of magnetite, maghemite and iron oxyhydroxide nanoparticles. Solid State Sci.106, 106295 (2020). 10.1016/j.solidstatesciences.2020.106295 [DOI] [Google Scholar]
- 30.Wang, W., Xiao, K., Zhu, L., Yin, Y. & Wang, Z. Graphene oxide supported titanium dioxide & ferroferric oxide hybrid, a magnetically separable photocatalyst with enhanced photocatalytic activity for tetracycline hydrochloride degradation. RSC Adv7, 21287–21297 (2017). 10.1039/C6RA28224E [DOI] [Google Scholar]
- 31.Hong, C. H., Kim, M. W., Zhang, W. L., Moon, I. J. & Choi, H. J. Fabrication of smart magnetite/reduced graphene oxide composite nanoparticles and their magnetic stimuli-response. J. Colloid Interface Sci.481, 194–200 (2016). 10.1016/j.jcis.2016.07.060 [DOI] [PubMed] [Google Scholar]
- 32.Liu, M., Chen, C., Hu, J., Wu, X. & Wang, X. Synthesis of magnetite/graphene oxide composite and application for cobalt(II) removal. J. Phys. Chem. C115, 25234–25240 (2011). 10.1021/jp208575m [DOI] [Google Scholar]
- 33.Wang, Y. et al. Magnetic graphene oxide nanocomposites: Nanoparticles growth mechanism and property analysis. J. Mater. Chem. C Mater.2, 9478–9488 (2014). 10.1039/C4TC01351D [DOI] [Google Scholar]
- 34.Im, H. J., Jun, G. H., Lee, D. J., Ryu, H. J. & Hong, S. H. Enhanced electromagnetic interference shielding behavior of Graphene Nanoplatelet/Ni/Wax nanocomposites. J. Mater. Chem. C Mater.5, 6471–6479 (2017). 10.1039/C7TC01405H [DOI] [Google Scholar]
- 35.Wang, Y. et al. Facile one-pot synthesis of ultrathin carbon layer encapsulated magnetite nanoparticle and graphene oxide nanocomposite for efficient removal of metal ions. Sep. Purif. Technol.266, 118550 (2021). 10.1016/j.seppur.2021.118550 [DOI] [Google Scholar]
- 36.Yoon, Y. et al. Comparative evaluation of magnetite-graphene oxide and magnetite-reduced graphene oxide composite for As(III) and As(V) removal. J. Hazard. Mater.304, 196–204 (2016). 10.1016/j.jhazmat.2015.10.053 [DOI] [PubMed] [Google Scholar]
- 37.Shibu, M. C. et al. White LED active α-Fe2O3/rGO photocatalytic nanocomposite for an effective degradation of tetracycline and ibuprofen molecules. Environ. Res.212, 113301 (2022). 10.1016/j.envres.2022.113301 [DOI] [PubMed] [Google Scholar]
- 38.Freire, J. M. A. et al. Functionalized magnetic graphene oxide composites for selective toxic metal adsorption. Environ. Nanotechnol. Monit. Manag.20, 100843 (2023). [Google Scholar]
- 39.Ayub, S. et al. Optimization of magnetite with modified graphene for microwave absorption properties. J. Alloys Compd.936, 168182 (2023). 10.1016/j.jallcom.2022.168182 [DOI] [Google Scholar]
- 40.Han, Q. et al. Facile and tunable fabrication of Fe3O4/graphene oxide nanocomposites and their application in the magnetic solid-phase extraction of polycyclic aromatic hydrocarbons from environmental water samples. Talanta101, 388–395 (2012). 10.1016/j.talanta.2012.09.046 [DOI] [PubMed] [Google Scholar]
- 41.Raghu, M. S. et al. Adsorption and antimicrobial studies of chemically bonded magnetic graphene oxide-Fe3O4 nanocomposite for water purification. J. Water Process Eng.17, 22–31 (2017). 10.1016/j.jwpe.2017.03.001 [DOI] [Google Scholar]
- 42.Qi, T., Huang, C., Yan, S., Li, X. J. & Pan, S. Y. Synthesis, characterization and adsorption properties of magnetite/reduced graphene oxide nanocomposites. Talanta144, 1116–1124 (2015). 10.1016/j.talanta.2015.07.089 [DOI] [PubMed] [Google Scholar]
- 43.Vinodhkumar, G. et al. Solvothermal synthesis of magnetically separable reduced graphene oxide/Fe3O4 hybrid nanocomposites with enhanced photocatalytic properties. Phys. B Condens. Matter580, 411752 (2020). 10.1016/j.physb.2019.411752 [DOI] [Google Scholar]
- 44.Silva, J. M. P. et al. Investigating adsorption/photocatalysis of organic contaminants by Fe3O4–GO, Fe3O4–C3N4, and Fe3O4–GO-C3N4 heterojunctions. Chem. Inorg. Mater.1, 100014 (2023). [Google Scholar]
- 45.Vieira, Y. et al. New insights into the mechanism of heterogeneous activation of nano-magnetite by microwave irradiation for use as Fenton catalyst. J. Environ. Chem. Eng.8, 103787 (2020). 10.1016/j.jece.2020.103787 [DOI] [Google Scholar]
- 46.Moztahida, M., Jang, J., Nawaz, M., Lim, S. R. & Lee, D. S. Effect of rGO loading on Fe3O4: A visible light assisted catalyst material for carbamazepine degradation. Sci. Total Environ.667, 741–750 (2019). 10.1016/j.scitotenv.2019.02.376 [DOI] [PubMed] [Google Scholar]
- 47.Hosseini, S. M., Abdouss, M., Mazinani, S., Soltanabadi, A. & Kalaee, M. Modified nanofiber containing chitosan and graphene oxide-magnetite nanoparticles as effective materials for smart wound dressing. Compos. B Eng.231, 109557 (2022). 10.1016/j.compositesb.2021.109557 [DOI] [Google Scholar]
- 48.Veisi, H., Tamoradi, T., Rashtiani, A., Hemmati, S. & Karmakar, B. Palladium nanoparticles anchored polydopamine-coated graphene oxide/Fe3O4 nanoparticles (GO/Fe3O4@PDA/Pd) as a novel recyclable heterogeneous catalyst in the facile cyanation of haloarenes using K4[Fe(CN)6] as cyanide source. J. Ind. Eng. Chem.90, 379–388 (2020). 10.1016/j.jiec.2020.06.030 [DOI] [Google Scholar]
- 49.Kakavandi, B. & Babaei, A. A. Heterogeneous Fenton-like oxidation of petrochemical wastewater using a magnetically separable catalyst (MNPs@C): Process optimization, reaction kinetics and degradation mechanisms. RSC Adv.6, 84999–85011 (2016). 10.1039/C6RA17624K [DOI] [Google Scholar]
- 50.Chai, P. V., Law, J. Y., Mahmoudi, E. & Mohammad, A. W. Development of iron oxide decorated graphene oxide (Fe3O4/GO) PSf mixed-matrix membrane for enhanced antifouling behavior. J. Water Process Eng.38, 101673 (2020). 10.1016/j.jwpe.2020.101673 [DOI] [Google Scholar]
- 51.Neolaka, Y. A. B. et al. The adsorption of Cr(VI) from water samples using graphene oxide-magnetic (GO-Fe3O4) synthesized from natural cellulose-based graphite (kusambi wood or Schleichera oleosa): Study of kinetics, isotherms and thermodynamics. J. Mater. Res. Technol.9, 6544–6556 (2020). 10.1016/j.jmrt.2020.04.040 [DOI] [Google Scholar]
- 52.Mallesh, S., Jang, W. & Kim, K. H. Facile synthesis of cube-like Fe3O4-graphene oxide nanocomposites with excellent microwave absorption performance. Phys. Lett. Sect. A Gen. At. Solid State Phys.389, 127 (2021). [Google Scholar]
- 53.Harres, A. et al. Magnetic properties of graphene oxide decorated with magnetite nanoparticles. Diam. Relat. Mater.138, 110238 (2023). 10.1016/j.diamond.2023.110238 [DOI] [Google Scholar]
- 54.Pryadko, A. et al. A comprehensive study on in situ synthesis of a magnetic nanocomposite of magnetite and reduced graphene oxide and its effectiveness at removing arsenic from water. Nano-Struct. Nano-Objects36, 101028 (2023). 10.1016/j.nanoso.2023.101028 [DOI] [Google Scholar]
- 55.Bosio, M., Satyro, S., Bassin, J. P., Saggioro, E. & Dezotti, M. Removal of pharmaceutically active compounds from synthetic and real aqueous mixtures and simultaneous disinfection by supported TiO2/UV-A, H2O2/UV-A, and TiO2/H2O2/UV-A processes. Environ. Sci. Pollut. Res.26, 4288–4299 (2019). 10.1007/s11356-018-2108-x [DOI] [PubMed] [Google Scholar]
- 56.Lachheb, H. et al. Photochemical oxidation of styrene in acetonitrile solution in presence of H2O2 TiO2/H2O2 and ZnO/H2O2. J. Photochem. Photobiol. A Chem.346, 462–469 (2017). 10.1016/j.jphotochem.2017.06.026 [DOI] [Google Scholar]
- 57.Mehrali-Afjani, M., Nezamzadeh-Ejhieh, A. & Aghaei, H. A brief study on the kinetic aspect of the photodegradation and mineralization of BiOI-Ag3PO4 towards sodium diclofenac. Chem. Phys. Lett.759, 137873 (2020). 10.1016/j.cplett.2020.137873 [DOI] [Google Scholar]
- 58.Chen, W. H., Huang, J. R., Lin, C. H. & Huang, C. P. Catalytic degradation of chlorpheniramine over GO-Fe3O4 in the presence of H2O2 in water: The synergistic effect of adsorption. Sci. Total Environ.736, 139468 (2020). 10.1016/j.scitotenv.2020.139468 [DOI] [PubMed] [Google Scholar]
- 59.Zhou, K. et al. Degradation of emerging pharmaceutical micropollutants in municipal secondary effluents by low-pressure UVC-activated HSO5− and S2O82− AOPs. Chem. Eng. J.393, 124712 (2020). 10.1016/j.cej.2020.124712 [DOI] [Google Scholar]
- 60.Baptisttella, A. M. S. et al. Magnetic Fe3O4-graphene oxide nanocomposite–synthesis and practical application for the heterogeneous photo-Fenton degradation of different dyes in water. Sep. Sci. Technol. (Philadelphia)00, 1–14 (2020). [Google Scholar]
- 61.De Freitas, A. M., Sirtori, C., Lenz, C. A. & Zamora, P. G. P. Microcystin-LR degradation by solar photo-Fenton, UV-A/photo-Fenton and UV-C/H2O2: A comparative study. Photochem. Photobiol. Sci.12, 696–702 (2013). 10.1039/c2pp25233c [DOI] [PubMed] [Google Scholar]
- 62.Zhao, D. et al. Facile preparation of amino functionalized graphene oxide decorated with Fe3O4 nanoparticles for the adsorption of Cr(VI). Appl. Surf. Sci.384, 1–9 (2016). 10.1016/j.apsusc.2016.05.022 [DOI] [Google Scholar]
- 63.Lin, L., Wang, H., Jiang, W., Mkaouar, A. R. & Xu, P. Comparison study on photocatalytic oxidation of pharmaceuticals by TiO2-Fe and TiO2-reduced graphene oxide nanocomposites immobilized on optical fibers. J. Hazard. Mater.333, 162–168 (2017). 10.1016/j.jhazmat.2017.02.044 [DOI] [PubMed] [Google Scholar]
- 64.Bashiri, F., Khezri, S. M., Kalantary, R. R. & Kakavandi, B. Enhanced photocatalytic degradation of metronidazole by TiO2 decorated on magnetic reduced graphene oxide: Characterization, optimization and reaction mechanism studies. J. Mol. Liq.314, 113608 (2020). 10.1016/j.molliq.2020.113608 [DOI] [Google Scholar]
- 65.da Silva, M. P. et al. Photodegradation of Reactive Black 5 and raw textile wastewater by heterogeneous photo-Fenton reaction using amino-Fe3O4-functionalized graphene oxide as nanocatalyst. Environ. Adv.4, 100064 (2021). 10.1016/j.envadv.2021.100064 [DOI] [Google Scholar]
- 66.Paiva, V. A. B. et al. Simultaneous degradation of pharmaceuticals by classic and modified photo-Fenton process. J. Environ. Chem. Eng.6, 1086–1092 (2018). 10.1016/j.jece.2018.01.013 [DOI] [Google Scholar]
- 67.Liu, C., Liu, Y., Dang, Z., Zeng, S. & Li, C. Enhancement of heterogeneous photo-Fenton performance of core-shell structured boron-doped reduced graphene oxide wrapped magnetical Fe3O4 nanoparticles: Fe(II)/Fe(III) redox and mechanism. Appl. Surf. Sci.544, 148886 (2021). 10.1016/j.apsusc.2020.148886 [DOI] [Google Scholar]
- 68.Li, Q., Kong, H., Li, P., Shao, J. & He, Y. Photo-Fenton degradation of amoxicillin via magnetic TiO2-graphene oxide-Fe3O4 composite with a submerged magnetic separation membrane photocatalytic reactor (SMSMPR). J. Hazard. Mater.373, 437–446 (2019). 10.1016/j.jhazmat.2019.03.066 [DOI] [PubMed] [Google Scholar]
Associated Data
This section collects any data citations, data availability statements, or supplementary materials included in this article.
Supplementary Materials
Data Availability Statement
All the data generated during this study are included in this published article and its Supplementary Information files.


