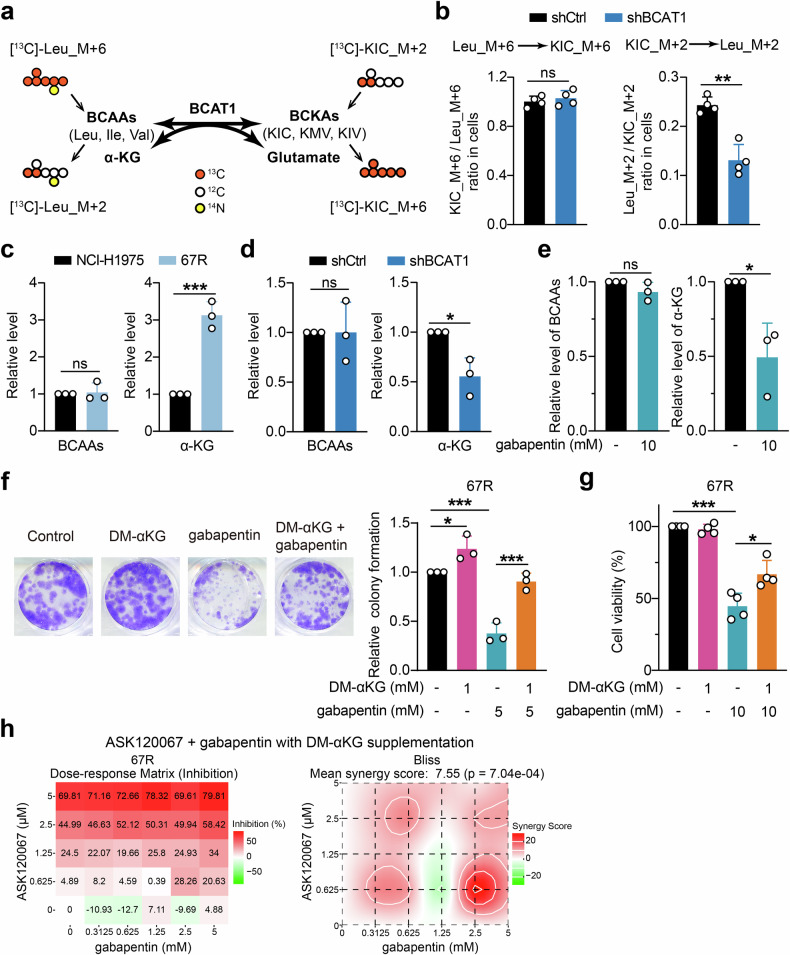
Fig. 4.
Increased α-KG production was involved in BCAT1-mediated cell growth and resistance. a Schematic outline of BCAT1-mediated reversible transamination and isotope tracing experiment. b Ratios of the labeled metabolites in control 67R cells (shCtrl) and BCAT1-knockdown 67R cells (shBCAT1) (n = 4). c Comparison of intracellular BCAA levels and α-KG levels in NCI-H1975 and 67R cells (n = 3). d, e Effects of BCAT1 knockdown (d) or the BCAT1 inhibitor gabapentin (e) on cellular BCAA levels and αKG levels in 67R cells (n = 3). f Colony formation of 67R cells upon dimethyl-KG (DM-αKG), gabapentin or combination treatment was evaluated and shown as representative images and a quantitative graph (n = 3). g Cell viability of 67R cells upon dimethyl-KG (DM-αKG), gabapentin or combination treatment was evaluated using SRB colorimetric assay (n = 4). h Anti-proliferation effects of gabapentin and ASK120067 with DM-αKG supplementation on 67R cells were detected using SRB colorimetric assay, and showed as dose-response matrix (left) and synergy score matrix (right). Synergy scores were calculated by SynergyFinder using Bliss model. *p < 0.05, **p < 0.01, ***p < 0.001; ns, not significant. Data are expressed as the mean ± SD

