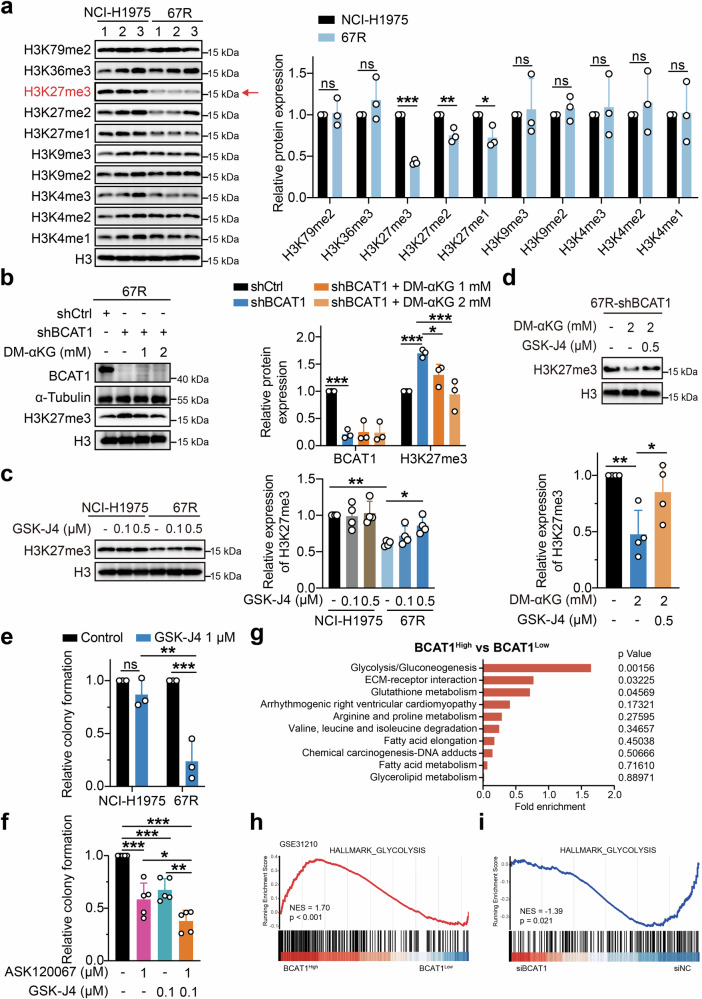
Fig. 5.
BCAT1 promoted α-KG-dependent H3K27 demethylation in resistant cells. a The indicated histone methylation levels in NCI-H1975 cells and 67R cells were determined using Western blotting and are shown as representative images (left) and densitometric quantitative results (right) (n = 3). b The effects of BCAT1 knockdown and cell-permeable dimethyl-αKG (DM-αKG) supplementation on H3K27me3 expression in 67R cells were detected by Western blotting and are shown as representative images (left) and a quantitative graph (right). Cells were treated with the indicated agent for 24 h (n = 3). shCtrl: 67R-shControl; shBCAT1: 67R-shBCAT1. c NCI-H1975 cells and 67R cells were treated with the indicated doses of GSK-J4 for 48 h, and the protein levels of H3K27me3 were determined by Western blot assay (n = 4). Representative images (left) and quantification results (right) are shown. d The effects of α-KG and GSK-J4 on H3K27me3 levels in BCAT1-knockdown 67R (shBCAT1) cells were determined. Cells were treated with 2 mM DM-αKG for 24 h and/or 0.5 µM GSK-J4 for 48 h (n = 4). Representative immunoblotting images (top) and quantitative graphs (bottom) are shown. e The anti-growth effects of GSK-J4 in NCI-H1975 or 67R cells were detected using a colony formation assay (n = 3). f Relative colony formation of 67R upon ASK120067, GSK-J4, or drug combination treatment (n = 5). g KEGG pathway enrichment analysis of pathways presented in Fig. 1c for BCAT1-high expression samples versus BCAT1-low expression samples from the clinical dataset GSE31210. The samples of the dataset were stratified based on high versus low expression (cutoff, median) of BCAT1 mRNA in lung adenocarcinoma tumors. h Gene set enrichment analysis (GSEA) showed that the glycolysis pathway was enriched in the BCAT1 high expression phenotype of the clinical dataset GSE31210. i BCAT1-knockdown 67R (siBCAT1) cells and control 67R (siNC) cells were subjected to transcriptomic analysis, and GSEA demonstrated downregulation of the glycolysis pathway in siBCAT1 cells. *p < 0.05, **p < 0.01, ***p < 0.001; ns, not significant. Data are expressed as the mean ± SD

