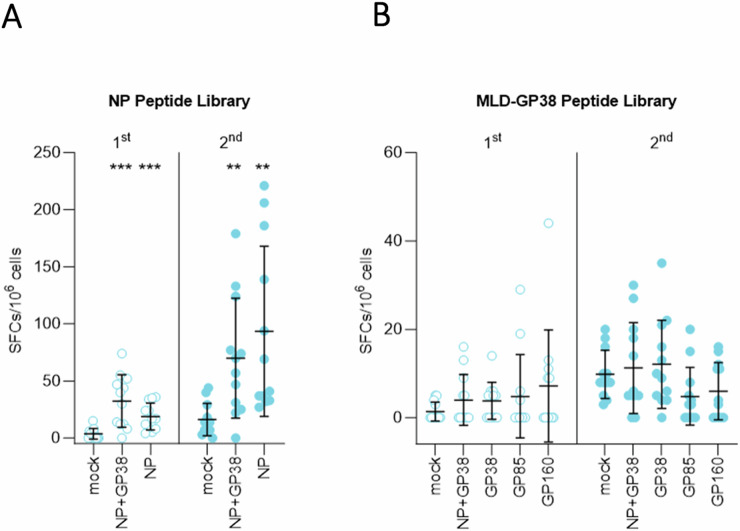
Fig. 4. Cellular immune responses after vaccination.
Cellular immune responses were investigated using peptide libraries of CCHFV 10200 NP and Hoti MLD-GP38. IFN-gamma recall responses detected from splenocytes of mice to A NP and B MLD-GP38 peptide libraries. In each graph, the left panel shows responses following the first vaccination, and the right panel shows responses following the second vaccination; data are represented as number of spot-forming cells (SFCs) in 106 peptide-stimulated splenocytes. All samples were tested in duplicate, and results were normalized to PMA control of each sample. Horizontal line represents the median value for the group. Two-tailed nonparametric t tests and ordinary one-way ANOVA (**p < 0.001; ***p < 0.0003) were used for statistical analyses when applicable. Statistical analyses compare vaccine groups and mock-vaccinated animals at corresponding timepoints.

