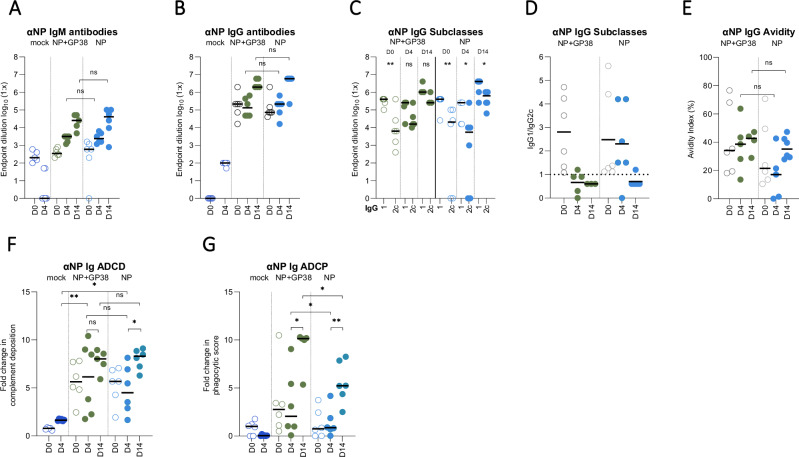
Fig. 7. Anti-NP humoral immune responses to CCHFV challenge.
NP-specific IgM A and IgG B responses 4 and 14 days post challenge (dpc) were determined as endpoint titers in plasma samples. C IgG1 and IgG2c titers were determined as endpoint titers in plasma samples. D IgG1 to IgG2c ratios were determined by dividing the endpoint titers of IgG1 by endpoint titers of IgG2 from individual animals. The dotted horizontal line represents IgG1:IgG2c ratio = 1. E Avidity indices of anti-NP antibodies of vaccinated animals were determined 4 and 14 dpc. For the avidity of IgG antibodies, AUC of 7-point dilutions of urea-treated and untreated samples were determined, and the avidity index was calculated as follows: (AUC of the urea-treated sample/AUC of untreated sample) × 100. Each dot on the graphs represents the mean value of the replicates from each animal and the horizontal line represents the median value for the group. ADCD function of anti-NP F antibodies represented as the fold change in complement deposition, and ADCP function G represented as fold change in phagocytic score over mock-vaccinated animals of corresponding timepoint 0 and 4 dpc. Results at 14 dpc were represented as fold change over 4 dpc mock-vaccinated animals. All samples were tested in duplicate. Two-tailed nonparametric t test and ordinary one-way ANOVA (*p < 0.05; **p < 0.001; ***p < 0.0003) were used for statistical analyses when applicable. Statistical analyses for IgM and IgG titers were conducted between plasma samples collected 4 and 14 dpc from NP + GP38-vaccinated and NP-vaccinated animal samples to compare endpoint titers. For IgG subclasses, statistical analyses were performed using IgG1 and IgG2 titers of individual vaccine groups in plasma samples collected on 0, 4, and 14 dpc. For IgG avidity, statistical analyses were performed between plasma samples of NP + GP38-vaccinated and NP-vaccinated animals collected 4 and 14 dpc.

