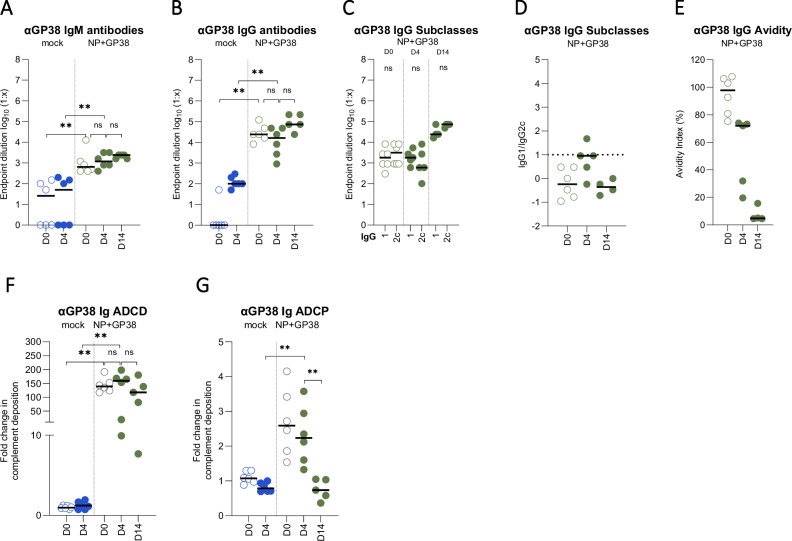
Fig. 8. Anti-GP38 humoral immune responses to CCHFV challenge.
GP38-specific IgM A and IgG B responses 4 and 14 dpc were determined as endpoint titers in plasma samples. C IgG1 and IgG2c titers were determined as endpoint titers in plasma samples. D IgG1 to IgG2c ratios were determined by dividing the endpoint titers of IgG1 by IgG2 titers in samples from individual animals. Dotted horizontal line represents IgG1:IgG2c = 1. E The avidity indices of anti-GP38 antibodies of vaccinated animals 4 and 14 dpc were determined. For the avidity of IgG antibodies, AUC of 7-point dilutions of urea-treated and untreated samples were determined, and the avidity index calculated as follows: (AUC of the urea-treated sample/AUC of untreated sample) × 100. Each dot on the graphs represents the mean value of the replicates from each animal and the horizontal line represents the median value for the group. ADCD function of F anti-GP38 antibodies represented as the fold change in complement deposition, and ADCP function G represented as fold change in phagocytic score over mock-vaccinated animals of corresponding timepoint 0 and 4 dpc. Results at 14 dpc were represented as fold change over 4 dpc mock-vaccinated animals. All samples were tested in duplicate. Two-tailed nonparametric t test and ordinary one-way ANOVA (*p < 0.05; **p < 0.001; ***p < 0.0003) were used for statistical analyses when applicable. Statistical analyses for IgM and IgG titers were conducted between plasma samples collected 0, 4 and 14 dpc from NP + GP38-vaccinated animal samples to compare endpoint titers. For IgG subclasses, statistical analyses were performed with IgG1 and IgG2 titers of individual vaccine groups in plasma samples collected 4 and 14 dpc. For IgG avidity, statistical analyses were performed between plasma samples collected 4 and 14 dpc from NP + GP38-vaccinated animals.

