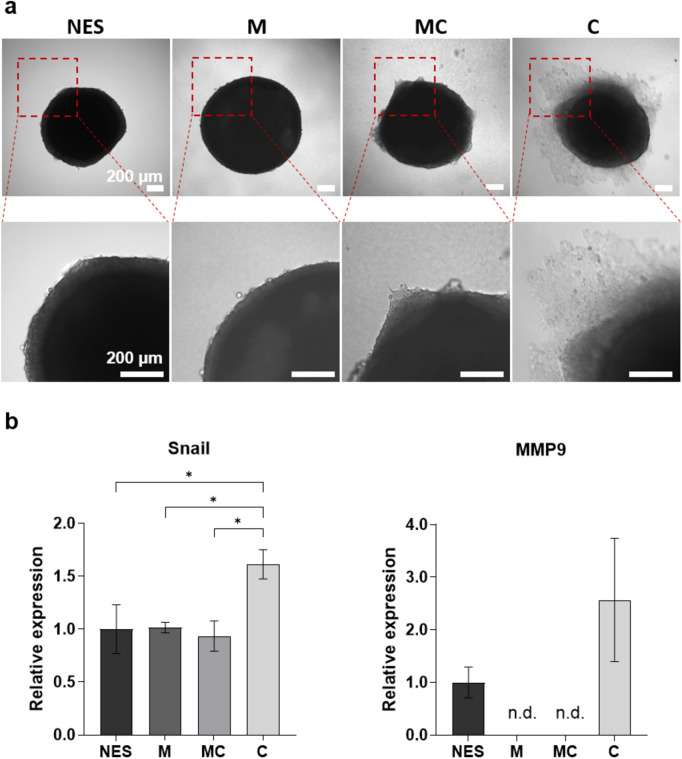
Figure 1.
Effect of different matrices on cell migration in HCT-116-GFP spheroids cultured for seven days. (a) Representative images of non-embedded and embedded HCT-116-GFP spheroids in different matrices. Upper panel shows the whole spheroid; lower panel shows zoomed-in section. Scale bar: 200 µm. (b) Analysis of mRNA expression of Snail and MMP9 in non-embedded and embedded HCT-116-GFP spheroids in different matrices. NES: non-embedded spheroids, M: Matrigel®, C: collagen I and MC: mixture of Matrigel® and collagen I. n = 3. n.d. = not detected (ct-value > 35.00). Data are shown as mean ± SD (*p < 0.05).

