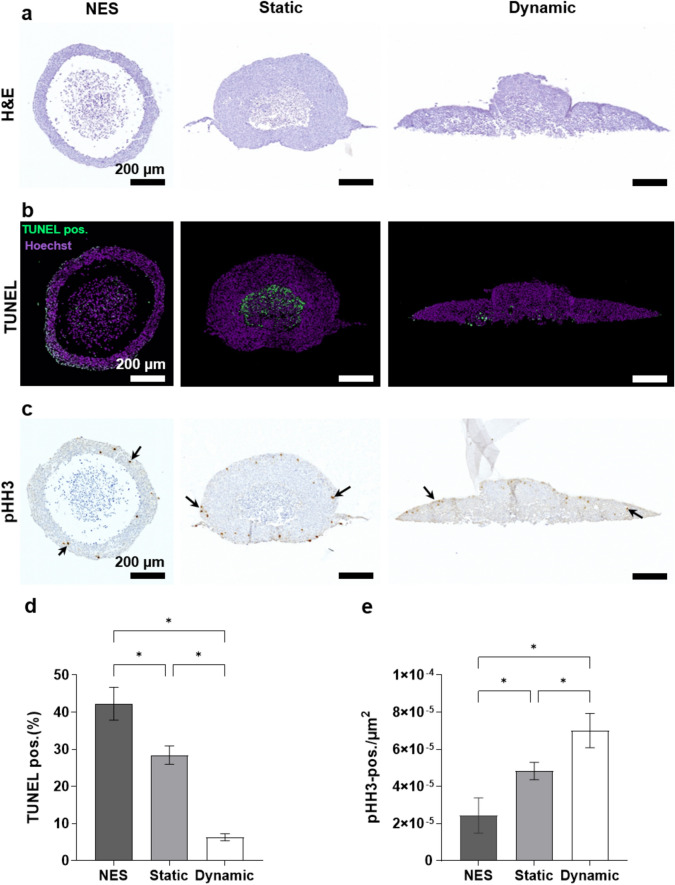
Figure 5.
Histology staining of HCT-116-GFP spheroids in non-embedded spheroids (NES), static and dynamic culture conditions. (a) H&E staining. (b) TUNEL assay. (c) Immunohistochemistry with specific antibody against pHH3, arrows indicate pHH3-positive cells. (d) Quantitative result of TUNEL assay, the number of TUNEL-positive cells (green) is normalized to the total nuclei (purple). (e) Quantitative result of pHH3 staining, the number of pHH3-positive cells is normalized to the total area of spheroids. Scale bar: 200 µm. Data are shown as mean ± SD. n = 4 (*p = < 0.05).

