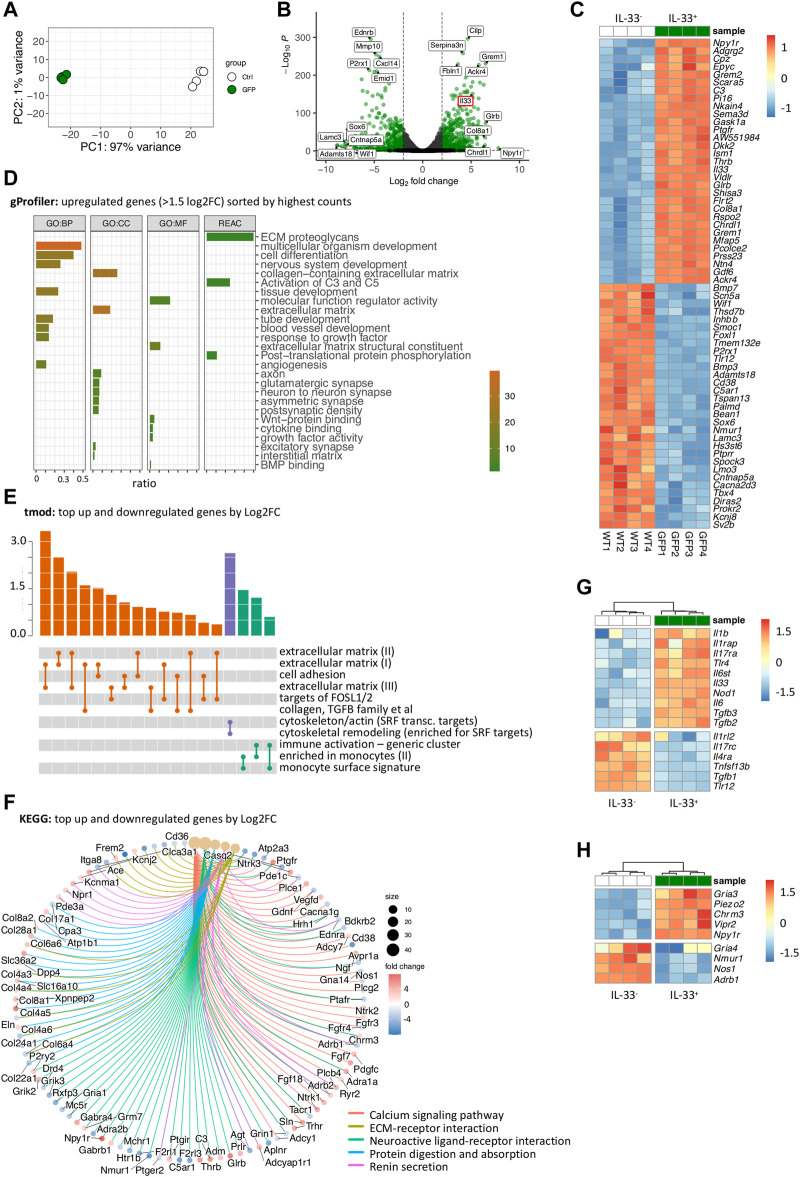
FIGURE 2.
Transcriptional profiling of IL-33-GFP+ stromal cells reveals a plethora of molecular interactions with immune cells, neurons, epithelial cells and the extracellular matrix (A) Principal component analysis of RNA-Seq of IL-33-eGFP− and IL-33-eGFP+ stromal cells. (B) Volcano plot of RNA-Seq from (A) showing differentially expressed genes and upregulation of Il33. (C) Heatmap of the top 30 up- and down-regulated genes (by log2FC) in IL-33-eGFP+ and IL-33-eGFP− intestinal stromal cells. (D) Top upregulated pathways after gProfiler gene ontology analysis of significantly differentially expressed genes with a Log2FC > 1.5 and sorted by BaseMean (counts) of IL-33-eGFP+ and IL-33-eGFP− intestinal stromal cells. (E) Top pathways after tmod gene ontology analysis of significantly differentially expressed genes of IL-33-eGFP+ and IL-33-eGFP− intestinal stromal cells. (F) Top pathways after KEGG gene ontology analysis of significantly differentially expressed genes of IL-33-eGFP+ and IL-33-eGFP− intestinal stromal cells. (G,H) Heatmaps of immune related genes (G) and neuron related genes (H).

