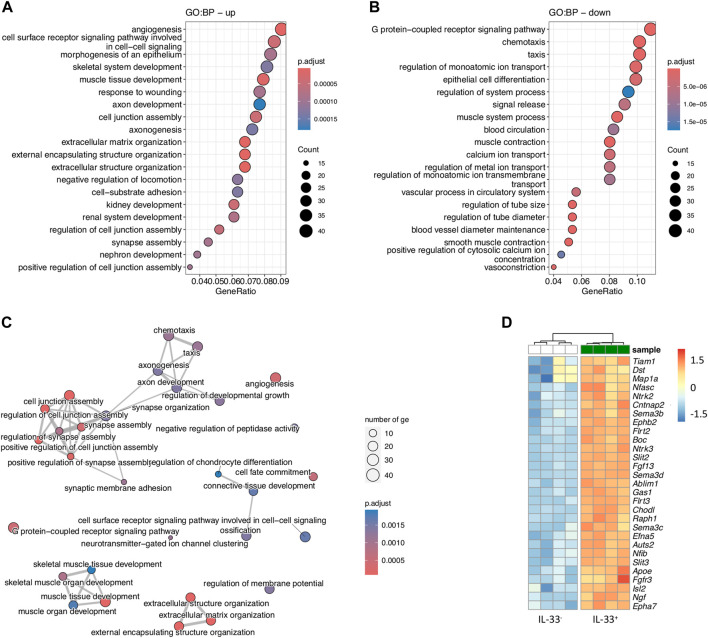
FIGURE 3.
Gene Ontology analysis of IL-33-eGFP+ intestinal stromal cells suggests their involvement in axon guidance and (A, B) Gene ontology analysis using downregulated (A) and upregulated (B) genes between IL-33-eGFP+ vs. IL-33-eGFP- intestinal stromal cells. (C) Netplot showing pathways from (A) and (B). (D) Heatmap of differentially expressed genes from GO:BP pathway axonogenesis.

