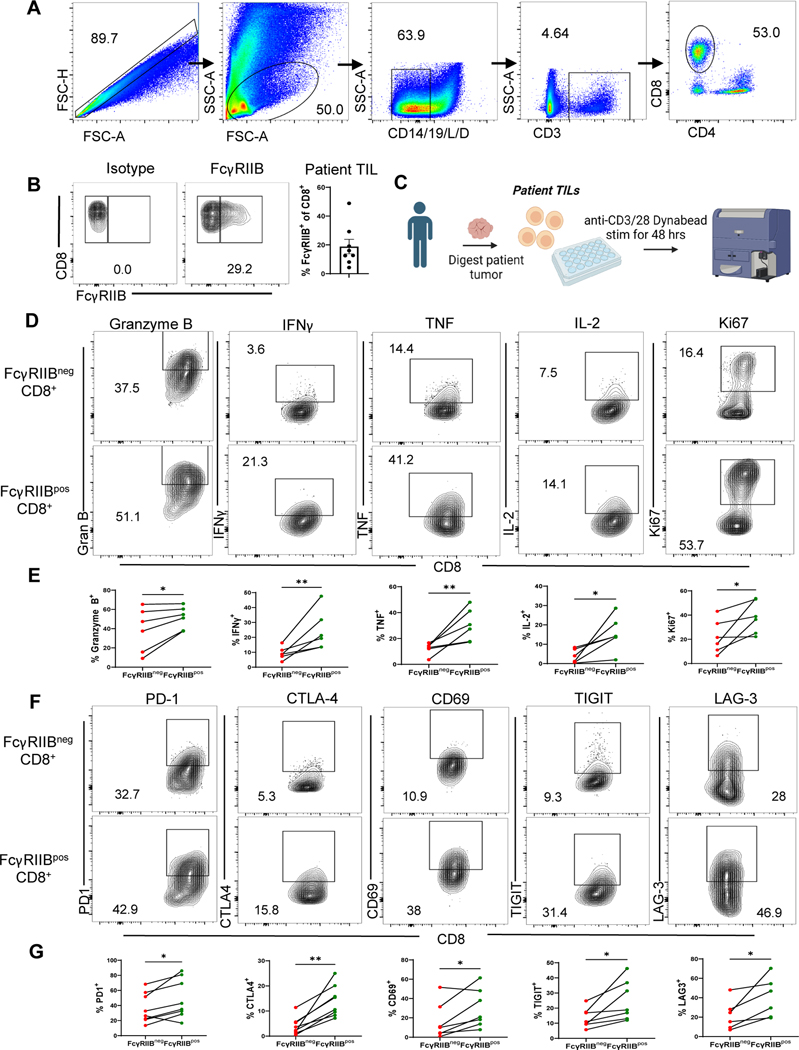
Fig. 2. FcγRIIB is expressed on activated, cytokine-producing patient CD8+ tumor-infiltrating lymphocytes (TIL) that also expressT cell checkpoint molecules.
(A) Flow cytometry plots showing gating strategy for excluding dead cells and contaminating CD14+and CD19+ cells and gating on the FcγRIIBpos population in human CD8+ TIL. (B) Representative flow cytometry plots and quantification of isotype versus FcγRIIB staining on human CD8+ TIL (n=8). (C) Schematic of experimental setup wherein TIL isolated from patients with melanoma were stimulated in vitro for 48 h with anti-CD3/CD28 beads, then Golgi Stop was added 4h prior to harvest and cells were stained for extracellular and intracellular markers (D) Representative flow plots and (E) quantification showing frequencies of Granzyme B+, IFNγ+, TNF+, IL-2+, and Ki67+ of FcγRIIBpos as compared to FcγRIIBneg CD8+ patient TIL (n=6). (F) Representative flow plots and (G) quantification showing frequencies of PD-1+, CTLA-4+, CD69+, TIGIT+, and LAG-3+ on FcγRIIBpos and FcγRIIBneg CD8+ patient TIL (n=7–8). The error bar in summary figures denotes mean ± SEM. *P<0.05, **P<0.01, Wilcoxon matched-pairs rank test.

