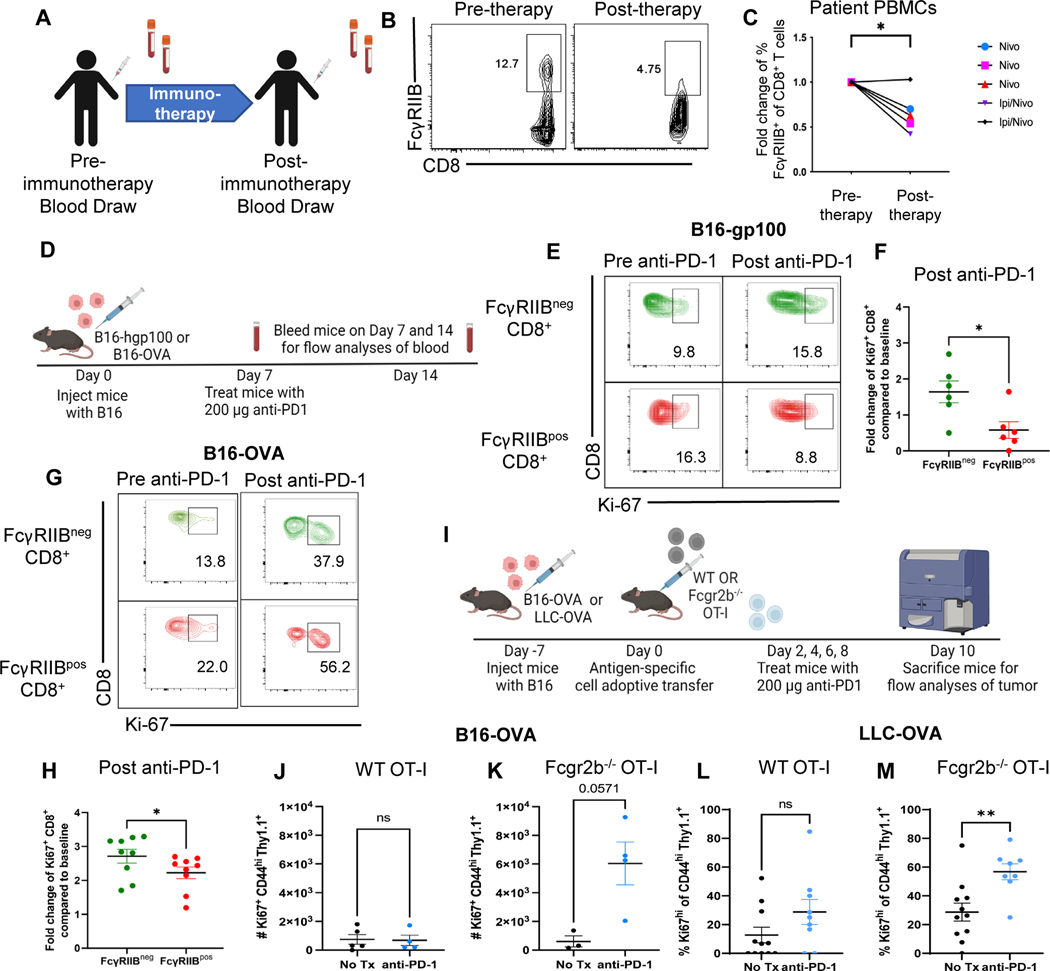
Fig. 4. PD-1 checkpoint blockade results in a loss of FcγRIIBpos CD8+ T cells in patients with melanoma and in B16 and LLC mouse models.
(A) Blood samples were drawn at baseline and following one dose of anti-PD-1 mAb. Fresh PBMCs were processed directly after collection and stained for extracellular surface markers (B) Representative flow cytometry plots of the frequency of FcγRIIBpos CD8+ T cells at baseline (pre-anti-PD-1) and after one cycle of anti-PD-1 mAb (post-anti-PD-1). (C) Quantification of the frequency of FcγRIIBpos of CD8+ T cells at baseline and one cycle of anti-PD-1 mAb, frequency of FcγRIIBpos of CD8+ T cells were normalized to the frequency of the patient’s FcγRIIBpos CD8+ T cells prior to initiation of anti- PD-1 therapy. (D) Schematic of the mouse model and treatment used wherein C57BL/6J mice were challenged with B16-gp100 or B16-OVA melanoma and blood was drawn from mice before (day 7) and after PD-1 blockade (day 14) to measure proliferation of FcγRIIBpos and FcγRIIBneg CD8+ T cells during PD-1 blockade (n=6). (E) Representative flow plots showing the frequency of Ki-67+ FcγRIIBpos and FcγRIIBneg CD8+ T cells before and after PD-1 blockade in the B16-gp100 model. (F) Quantification of fold change values shown from the B16-gp100 model. The blood was lysed and underwent extracellular and intracellular staining for flow cytometric analyses (n=6). (G) Representative flow plots showing the frequency of Ki-67+ FcγRIIBpos and FcγRIIBneg CD8+ T cells before and after PD-1 blockade in the B16-OVA mouse model. (H) Quantification of the frequency of Ki-67+ CD8+ T cells within FcγRIIBpos and FcγRIIBneg CD8+ T cells (n=6). Fold change compared to baseline is the frequency of Ki-67+ cells after PD-1 over the frequency of Ki-67+ cells before PD-1 blockade. (I) Schematic shown wherein C57BL/6J mice were challenged with B16-OVA or LLC-OVA. One week later, one million WT or Fcgr2b−/− OT-I transgenic CD8+ T cells were harvested from donor spleen and adoptively transferred into challenged B6 mice. Mice were then treated with 200 μg of PD-1 antibody or PBS on days 2, 4, 6, and 8 and then sacrificed for flow analyses of tumor. Quantification of the number of Ki67+ OT-Is isolated from the tumors of anti-PD1 treated versus untreated mice that were given (J) WT OT-Is or (K) Fcgr2b−/− OT-Is in the B16-OVA model (n=4 per group). Quantification of frequency of Ki67+ OT-Is isolated from the tumors of anti-PD1 treated versus untreated mice that were given (L) WT OT-Is or (M) Fcgr2b−/− OT-Is in the LLC-OVA model (n=11 per group, pooled data from two experiments). The error bar in summary figures denotes mean ± SEM.Quantification, *P<0.05, **P<0.01, ns, not significant. Wilcoxon matched-pairs rank test.

