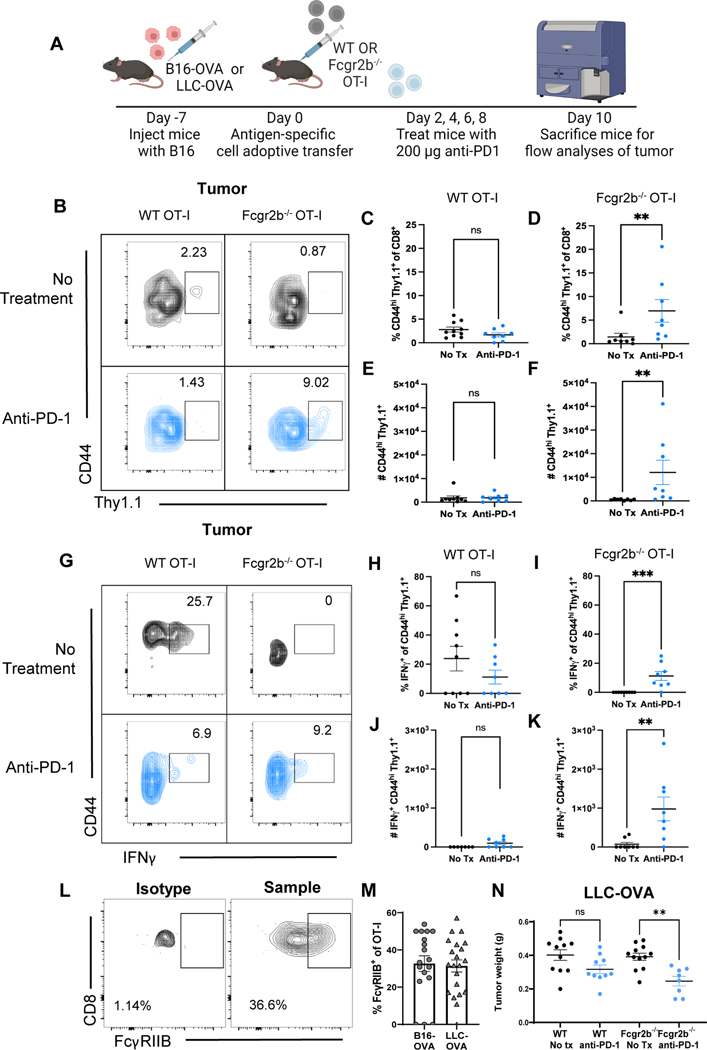
Fig. 5. T cell-expressed FcγRIIB restrains CD8+ T cell responsiveness to PD-1 blockade B16 and LLC mouse models in vivo.
(A) Schematic shown wherein C57BL/6J mice were inoculated with the B16-OVA cancer cell line. One week later, one million WT or Fcgr2b−/− OT-I transgenic CD8+ T cells were harvested from donor spleen and adoptively transferred into B16-challenged B6 mice. Animals were treated with 200 μg of PD-1 antibody or PBS on days 2, 4, 6, 8 post adoptive transfer (days 9, 11, 13, and 15 post tumor inoculation). Spleen and tumor tissues were harvested on day 10 post adoptive transfer (day 17 post tumor) for flow analyses. (B) Representative flow plot showing CD44hi Thy1.1+ WT and Fcgr2b−/− OT-I T cells in the tumor comparing the no treatment group and the anti-PD-1 treated group, n=8–10 per group, pooled data from two independent experiments. (C-F) Summary figures comparing the frequencies (C) and absolute cell numbers of (D) CD44hi WT versus the frequencies (E) and absolute cell numbers (F) Fcgr2b−/− OT-I T cells in the tumor, (G) Representative flow plot showing IFNγ+ CD44hi Thy1.1+ WT and Fcgr2b−/− OT-I T cells in the tumor comparing the no treatment and anti-PD-1 treatment groups, n=8–10 per group, pooled data from two independent experiments. (H-K) Summary figures comparing the frequencies (H) and absolute cell numbers (I) of IFNγ+ CD44hi WT versus the frequencies (J) and absolute cell numbers (K) of IFNγ+ Fcgr2b−/− OT-I T cells in the tumor. (L) Representative flow cytometry plots showing FcγRIIB staining on Thy1.1+ OT-Is compared to isotype control and (M) quantification showing FcγRIIB staining on Thy1.1+ OT-Is from the tumors of mice challenged with B16-OVA or LLC-OVA. (N) Summary figurecomparing tumor weight of mice challenged with LLC-OVA, timeline and experimental design as mentioned above, using LLC-OVA instead of B16-OVA cell line, n=10–12 per group. Mann-Whitney test or multiple comparisons in one-way ANOVA was used. The error bar in summary figures denotes mean ± SEM. *P<0.05, **P < 0.01, ***P < 0.001, ns, not significant.

