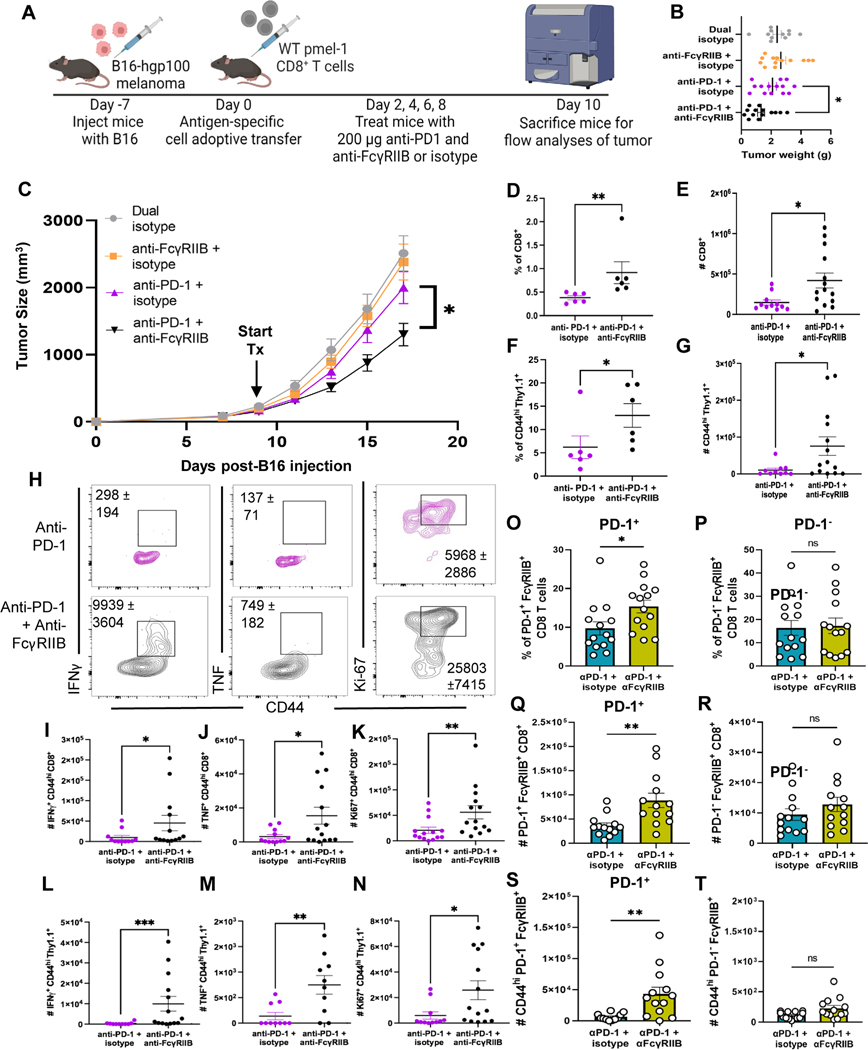
Fig. 6. Dual blockade of anti-FcγRIIB and anti-PD-1 promotes infiltration of CD8+ T cells into the tumor to delay tumor progression in a B16 melanoma mouse model.
(A) Schematic shown wherein C57BL/6J mice were inoculated with B16-hgp100 melanoma. One week later (tumors ~5mm), WT pmel-1 CD8+ T cells were isolated from mesenteric lymph node and spleen of donor pmel-1 mice and adoptively transferred into B16-hgp100-challenged mice. On days 2, 4, 6, and 8 post adoptive transfer (days 9, 11, 13, and 15 post tumor inoculation), mice were treated in four groups: 200 μg of IgG2a and IgG2b isotypes, 200 μg of anti-FcγRIIB + IgG2a isotype, 200 μg anti-PD-1 + 200 μg IgG2b, or 200 μg anti-PD-1 + 200 μg anti-FcγRIIB. On day 10 post adoptive transfer, (day 17 post tumor), the mice were sacrificed and draining lymph node, spleens, and tumor were harvested for flow cytometric analyses. (B) Tumor weight was measured after excision of each mouse and (C) tumor volume was measured with calipers for each mouse every other day after adoptive transfer to compose the tumor progression plot. Mice were sacrificed at humane endpoint defined by >2cm in either dimension, necrotic, or affected animal health/ mobility as approved by the Emory University IACUC, n=13–18 per group, pooled data from three independent experiments. (D) Quantification for the frequencies (data shown are representative of three independent repeats, n=4–6 per group) and (E) absolute cell number of bulk CD8+ T cells in PD-1 single blockade or PD-1 + FcγRIIB blockade treated animals. (F) Quantification for the frequencies (data shown are representative of three independent repeats, n=4–6 per group) and (G) absolute cell number of CD44hi Thy1.1+ pmel-1 CD8+ T cells in PD-1 single blockade or dual blockade treated animals. (H) Representative flow plots of CD44hi Thy1.1+ cells in both treatment groups, cell numbers ± SEM are shown on the flow plot as well. (I-K) Quantification for the absolute cell number of (I) CD44hi IFNγ+ and (J) CD44hi TNF+ CD8+ T cells as well as (K) CD44hi Ki67+ CD8+ T cells, pooled data from three independent experiments, n=11–14 per group. (L-N) Quantification for the absolute cell number of (L) CD44hi IFNγ+ and (M) CD44hi TNF+ Thy1.1+ pmel-1 CD8+ T cells as well as (N) CD44hi Ki67+ Thy1.1+ pmel-1 CD8+ T cells, pooled data from three independent experiments, n=11–14 per group. (O-R) Quantification for the (O) frequency and (P) absolute cell number of PD-1+FcγRIIB+ CD8+ T cells at the tumor and the (Q) frequency and (R) absolute cell number of PD-1−FcγRIIB+ CD8+ T cells as well as absolute cell number of (S) CD44hiPD-1+FcγRIIB+ CD8+ T cells and (T) CD44hiPD-1−FcγRIIB+ CD8+ T cells, pooled data from three independent experiments, n=14–15 per group. The error bar in summary figures denotes mean ± SEM. *P<0.05, **P < 0.01, ***P< 0.001, ns, not significant, Mann-Whitney Test.

