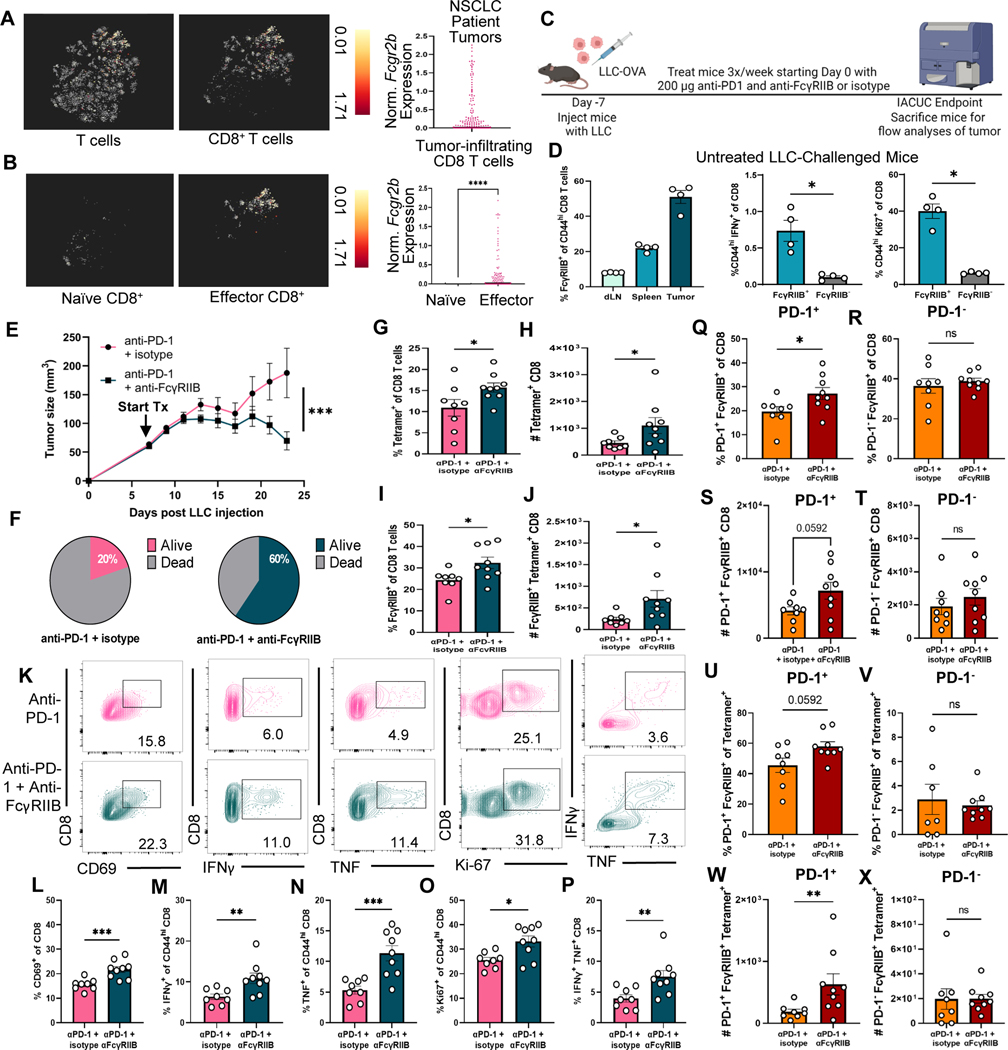
Fig. 7. Dual blockade of FcγRIIB and PD-1 elicits enhanced CD8+ T cell antitumor efficacy to regress tumors in an LLC lung carcinoma mouse model.
(A-B) Reanalysis of lung cancer TIL single cell datasets. (A) t-SNE plot from a publicly available single cell dataset visualizing FCGR2B expression on 9,005 single T cells isolated from NSCLC patient tumors (n=14) (left), followed by a t-SNE visualization of FCGR2B expression CD8+ T cells (middle), summary of FCGR2B expression within tumor-infiltrating CD8+ T cells (right), data normalized in log2 format and centered to each patient. (B) t-SNE plot projecting FCGR2B expression in naïve (left) versus dataset-defined effector (middle) CD8+ T cells at the tumor from the same publicly available single cell dataset of lung cancer samples with a summary plot of FCGR2B normalized in log2 format and centered to each patient (right). (C) Mice were inoculated with LLC-OVA cells. One week later (tumors ~5mm), treatment of 200 μg anti-PD-1 + 200 μg IgG2b or 200 μg anti-PD-1 + 200 μg anti-FcγRIIB three times a week until IACUC endpoint was reached. The mice were sacrificed and draining lymph nodes, spleens, and tumor were harvested for flow cytometric analyses. (D) Quantification measuring the frequency of FcγRIIB+ of CD44hi CD8+ T cells at the draining lymph node, spleen, and tumor (left) and the frequency of CD44hi IFNγ+ CD8+ T cells (middle) and of CD44hi Ki67+ CD8+ T cells (right) in cells stimulated ex vivo isolated from untreated LLC-challenged mice, n=4 per group. (E) Tumor progression of mice treated accordingly is displayed, tumor volume was measured with calipers for each mouse every other day after start of treatment. (F) Survival data were plotted on Kaplan-Meier curves, and a log-rank (Mantel-Cox) test was performed. (G-J) Quantification for the (G) frequency and (H) absolute cell number of tetramer+ CD8+ as well as the (I) frequency of FcγRIIB+ CD8+ and (J) absolute cell number of FcγRIIB+ tetramer+ CD8+ T cells in the tumor of treated mice. (K-P) Quantification for the frequency of (L) CD69+ CD8+, (M) IFNγ+ of CD44hi CD8+, (N) TNF+ of CD44hi CD8+, (O) Ki67+ of CD44hi CD8+ T cells, and (P) IFNγ+ TNF+ CD8+ T cells stimulated ex vivo from the tumors of treated mice, n=8–9 per group. Representative flow plots from both treatment groups are shown with the frequency shown on the flow plot as well. (Q-T) Quantification for the frequency (Q) and absolute cell number (R) of PD-1+FcγRIIB+ CD8+ T cells vs. the frequency (S) and absolute cell number (T) of PD-1−FcγRIIB+ CD8+. (U-X) Quantification for the frequency (U) and absolute cell number (V) of PD-1+FcγRIIB+ tetramer+ cells versus the frequency (W) and absolute cell number (X) of PD-1−FcγRIIB+ tetramer+ cellsat the tumor, n=8–9 per group. Mann-Whitney non-parametric, unpaired tests were used when comparing groups of mice. Area under curve was calculated and then total area was compared using an unpaired T test. The error bar in summary figures denotes mean ± SEM. ****P<0.0001, ***P<0.001, **P<0.01, *P<0.05, ns, not significant.

