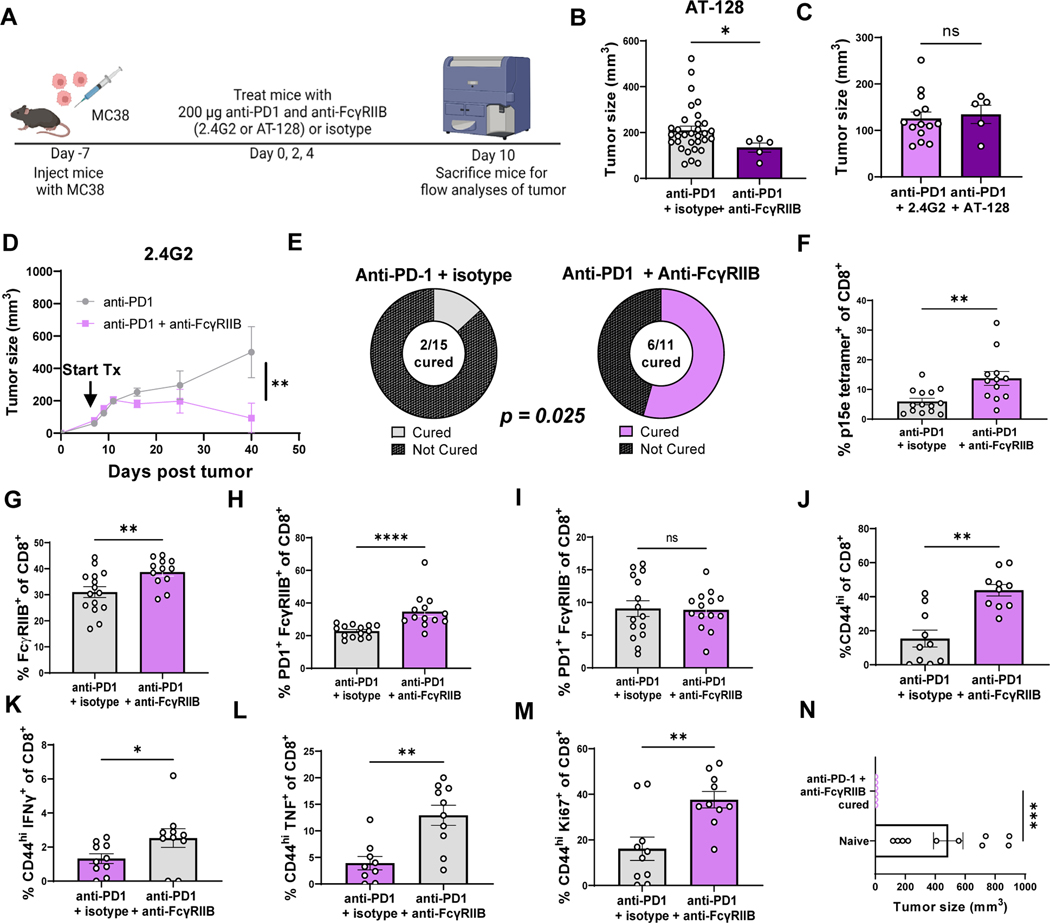
Fig. 8. Blocking FcγRIIB with clone 2.4G2 or non-cross-reactive FcγRIIB-specific antibody AT-128 increases response to anti-PD-1 therapy in an MC38 mouse colon cancer model.
(A) Schematic shown wherein C57BL/6J mice were inoculated with MC38 cells. One week later (tumors ~5mm), mice were treated with 200 μg anti-PD-1 + 200 μg IgG2b or 200 μg anti-PD-1 + 200 μg anti-FcγRIIB (clone 2.4G2 or clone AT-128) on days 0, 2, and 4. Mice were sacrificed and draining lymph nodes, spleens, and tumor were harvested for flow cytometric analyses on day 10 or IACUC endpoint. (B) Tumor size of mice treated with anti-PD1 and isotype or anti-PD1 and anti-FcγRIIB (clone AT-128) is displayed at sacrifice on day 10 (n=14–15 per group), pooled data from two experiments. (C) Tumor size of mice treated with anti-PD1 and anti-FcγRIIB (clone 2.4G2) or anti-PD1 and anti-FcγRIIB (clone AT-128) is displayed at sacrifice (n=32 or 5 per group). (D) Tumor time course is displayed with tumor volume as measured with calipers for each mouse every other day after start of treatment until IACUC endpoint (n=11 or 15 per group). (E) Pie graphs depicting proportion of MC38-challenged mice that were cured after anti-PD1 and isotype treatment vs anti-PD1 and anti-FcγRIIB (clone 2.4G2) (n=11 or 15 per group). Quantification for the (F) frequency of p15e tetramer+ CD8+ T cells, (G) frequency of FcγRIIB+ CD8+ T cells, and frequency of (H) PD-1+FcγRIIB+ CD8+ T cells versus (I) PD-1−FcγRIIB+ CD8+. Quantification for the frequency of (J) CD44hi CD8+, (K) CD44hi IFNγ+ CD8+, (L) CD44hi TNF+ of CD8+, (M) CD44hi Ki67+ of CD8+ T cells stimulated with p15e peptide ex vivo from the tumors of treated mice, n=9–10 per group, pooled data from two experiments. (N) Tumor size of mice rechallenged with MC38 tumors 10–12 weeks after tumor cure with anti-PD-1 + anti-FcγRIIB (n=6) or naïve mice controls challenged for first time. Mann-Whitney non-parametric, unpaired tests were used when comparing groups of mice. The error bar in summary figures denotes mean ± SEM. ****P<0.0001, ***P<0.001, **P<0.01, *P<0.05, ns, not signf.

