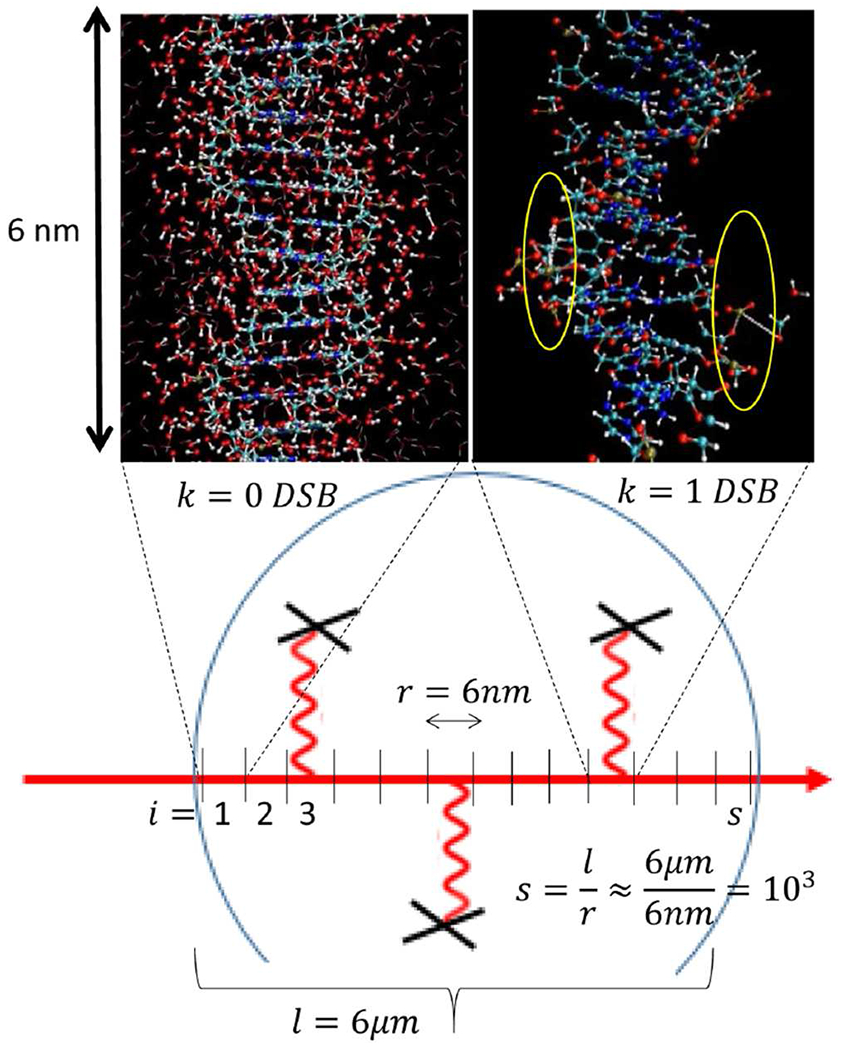
Fig. 1.

Schematically shown the partitioning of a cell nucleus (circular structure) into segments of proton-tracks (red lines) used as unit of ionization per MD simulation of DNA damage. The model calculation starts with scoring the ionizations and the time-evolution of chemical reactivity of species induced by ionized water molecules, in surrounding of DNA in sub nanometer and femto-second spatiotemporal scales. In upper left corner, a magnified structure of DNA surrounded by water molecules is depicted with no scored DSB induction. Shown in upper right corner, a typical snap-shot of distorted DNA obtained after running MD for ≈50ps. Two SSBs are highlighted by yellow circles, located within 10 base-pairs separation are indication of a DSB formation. Damaged bases, distorted hydrogen bonds, base-stacking as well as complex species such as hydrogen-peroxides formed from two OH• free radicals are visible. For clarity of the visualization, we removed water molecules from the image of the DNA molecule.
