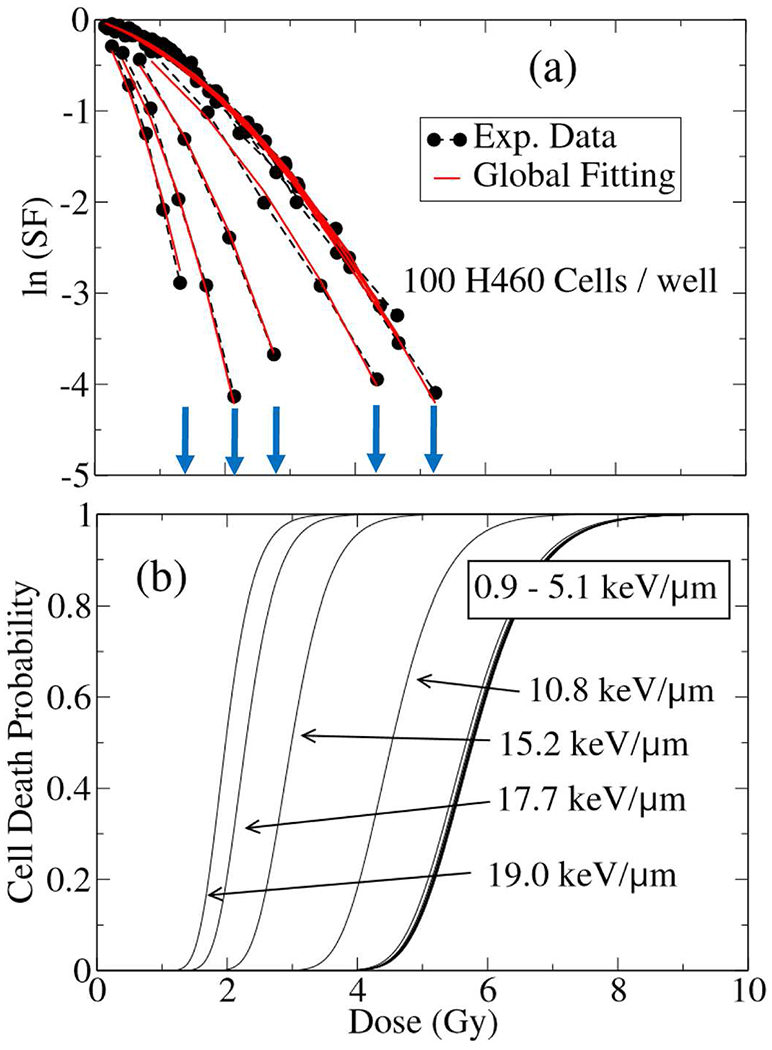
Fig. 10.

Shown (a) experimental (circles) fitted by three-dimensional global fitting (red bold lines) of cell survival fraction (SF) and (b) the cell death probability (CDP) of 100 H460 NSCLC used experimentally to measure SF in a 12 wells-plate as a function of dose and LET, irradiated by a single fraction of scanning proton with approximate nominal energy of 80MeV. The end points in SF where the radiation dose is highest, are indicated by arrows in (a), coincide with the onset of CDP sigmoid turning points. A sharp rise in sigmoid justifies termination in viability of cells seeded in the well, hence, a drop in their biological responses. With increase in LET, the maximum experimentally achievable doses in cell viability that terminate SF curves, lowers.
