
Fig. 2.
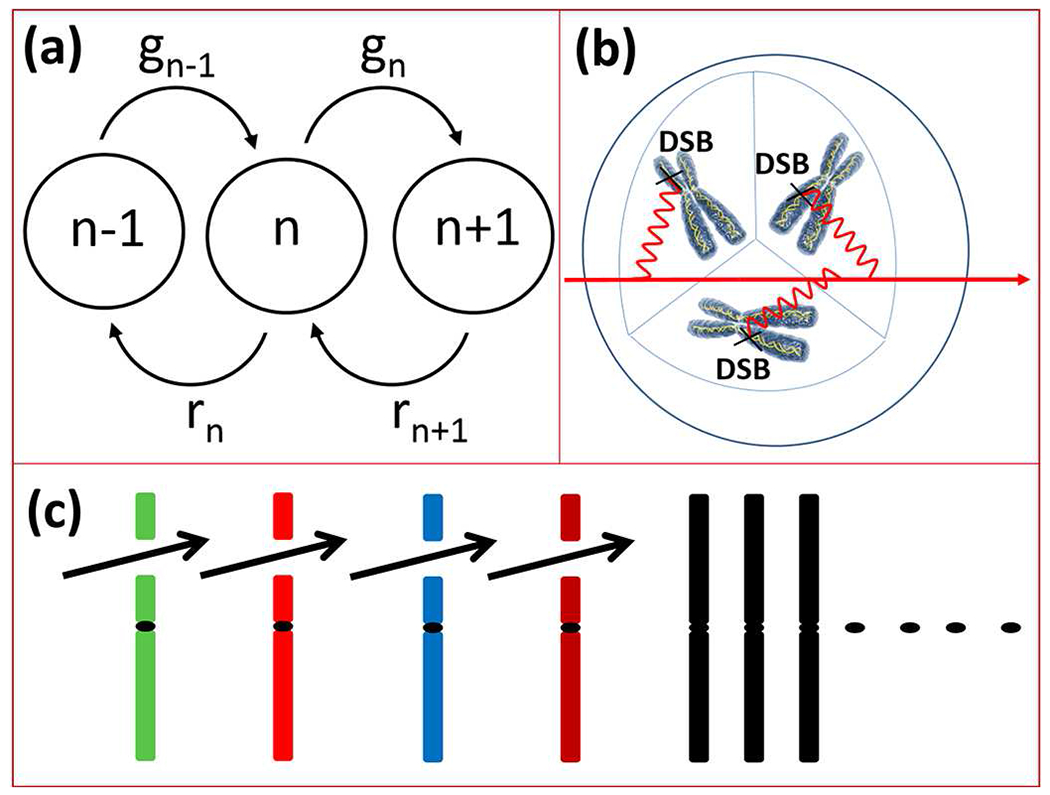
(a) Schematic diagram of Markov process in DSB rate equation, equation (1). (b) Schematic representation of DSB induction in a cell nucleus. The bold arrow represent a charged particle traversing cell nucleus. The wiggly lines were adopted from Feynman’s diagrams in quantum electrodynamics (QED) to describe propagation of interaction of a particle as a field in scattering processes with an interaction-site (see for example Ref. [52]). (c) Chromosomes undergo DSB induction after track of particles traverse the cell. Colored lines represent chromosomes and the gap between each chromosome represent a DSB. The black dots in the middle of each chromosome represent centromere. Black chromosomes were not gone through DSB formation after traversing charged particles.