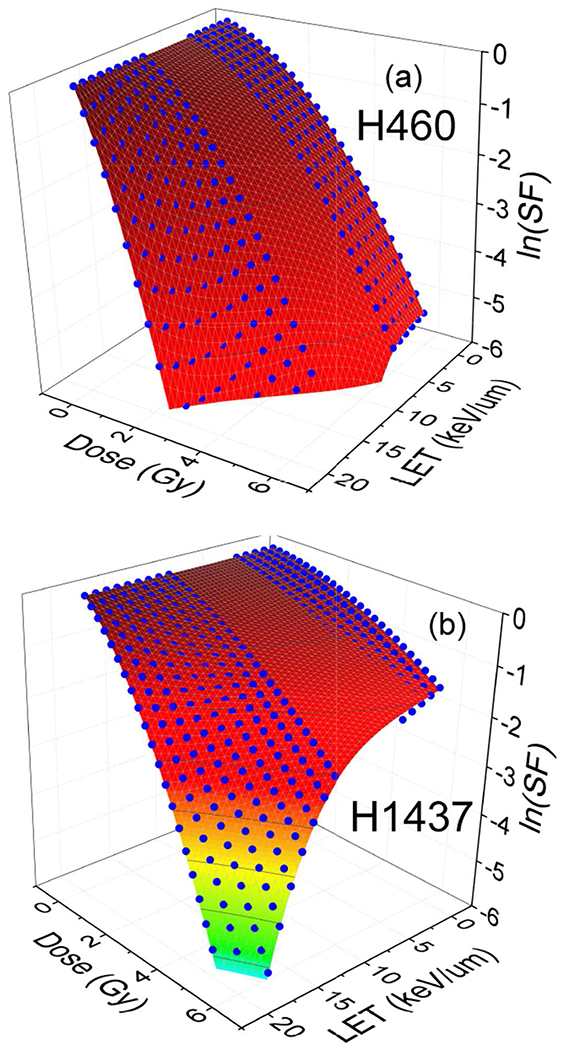
Fig. 6.

Shown H460 and H1437 cell survival as a function of dose (Gy) and dose averaged LETd (keV/μm). The blue dots are the result of 3D surface fitting to the experimental data presented in reference [41] with a gap between low and high LETs, 5.08 ≤ LETd ≤ 10.8. This gap appears because of lack of experimental data in intermediate domain of LET’s. In low and high LETs two sets of linear and non-linear polynomials used. The fitted surfaces to the blue dots are the result of second/post-processing fitting procedure presented in this work that provides a continuous and smooth connection between low and high LET data sets within intermediate domain of LETs.
