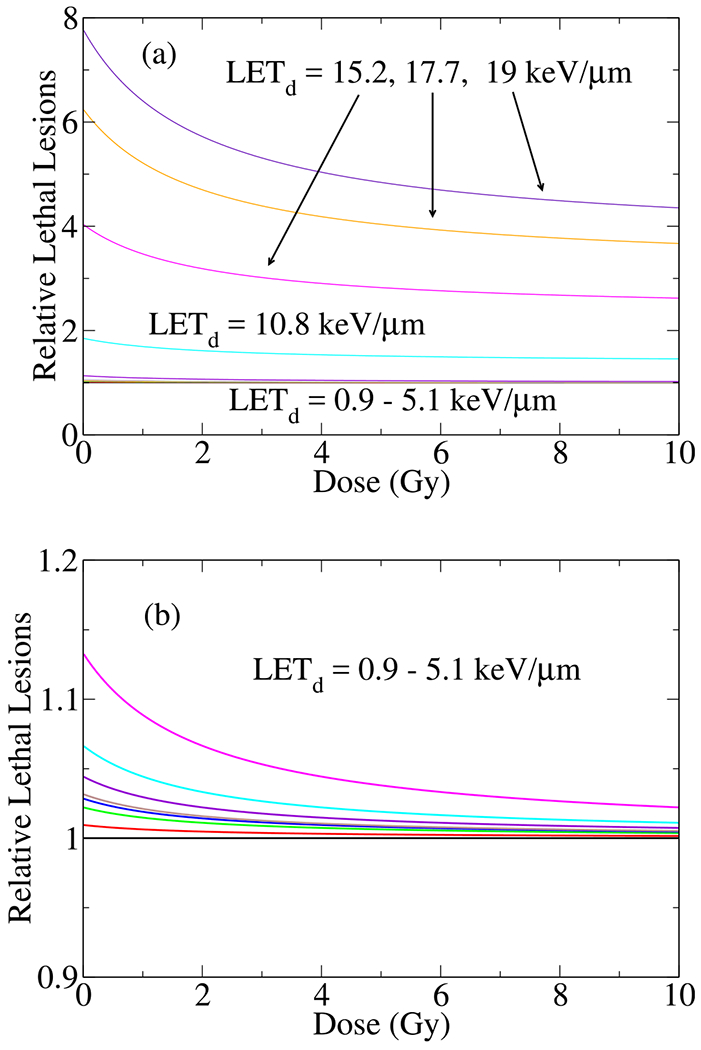
Fig. 8.

Shown H460 (a and b) relative lethal lesions per cell as a function of dose for different LETs. The relative lethal lesions, , were calculated using 3D global fitting of the experimental cell survival data within LQ model. It represents , normalized by the lethal lesions at the lowest LET, . For a better visualization of relative lethal lesions in low LETs, a magnified version of (a) is shown in (b).
