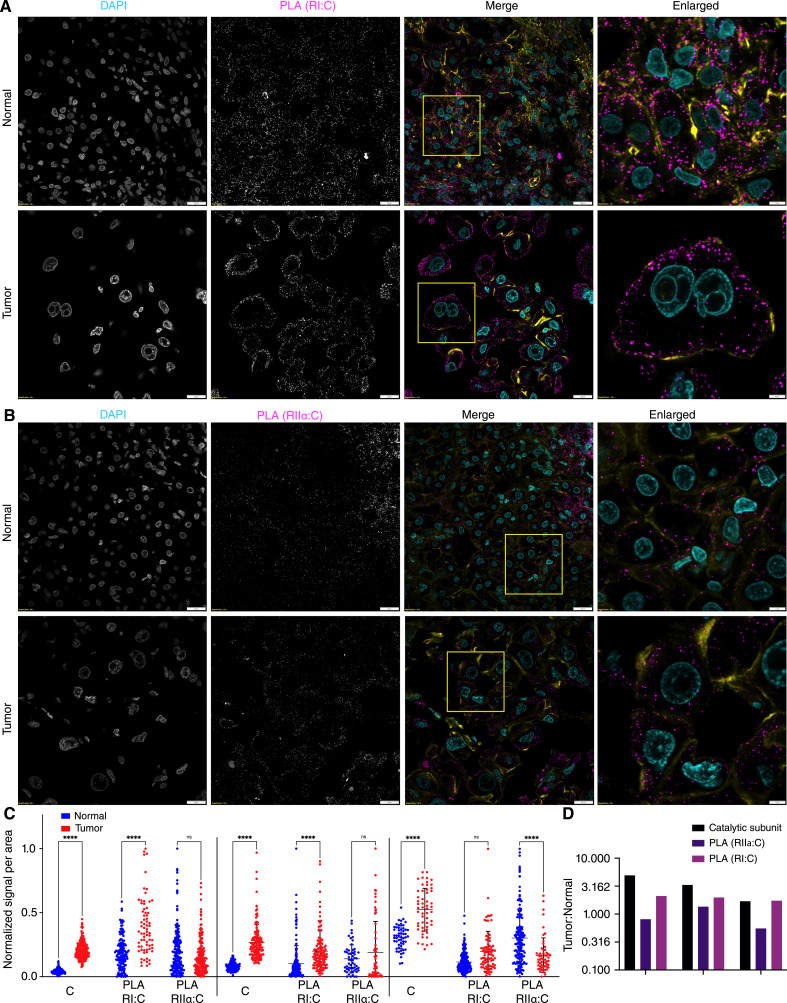
Figure 3.
Proximity ligation assay to detect binding of PKA catalytic and regulatory subunits. A and B, PLA using antibody against catalytic subunit and antibody against regulatory subunit RI (A) and RIIα (B). C, Analysis of PLA signals per cell reported as the total area of dots per area of cells for tumor and adjacent normal tissues from three different patients. Statistics were done using two-way ANOVA in PRISM. ****, P < 0.0001. D, Ratio of PKA catalytic subunit signal, PLA of C:RI, and PLA of C:RIIα in tumor over normal tissue in three different patients. Scale bars, 20 μm, except for the right column, which is 5 μm. In the merged images, DAPI is in cyan, PLA in maroon, and phalloidin (actin) in yellow. Note the use of log scale in D.

