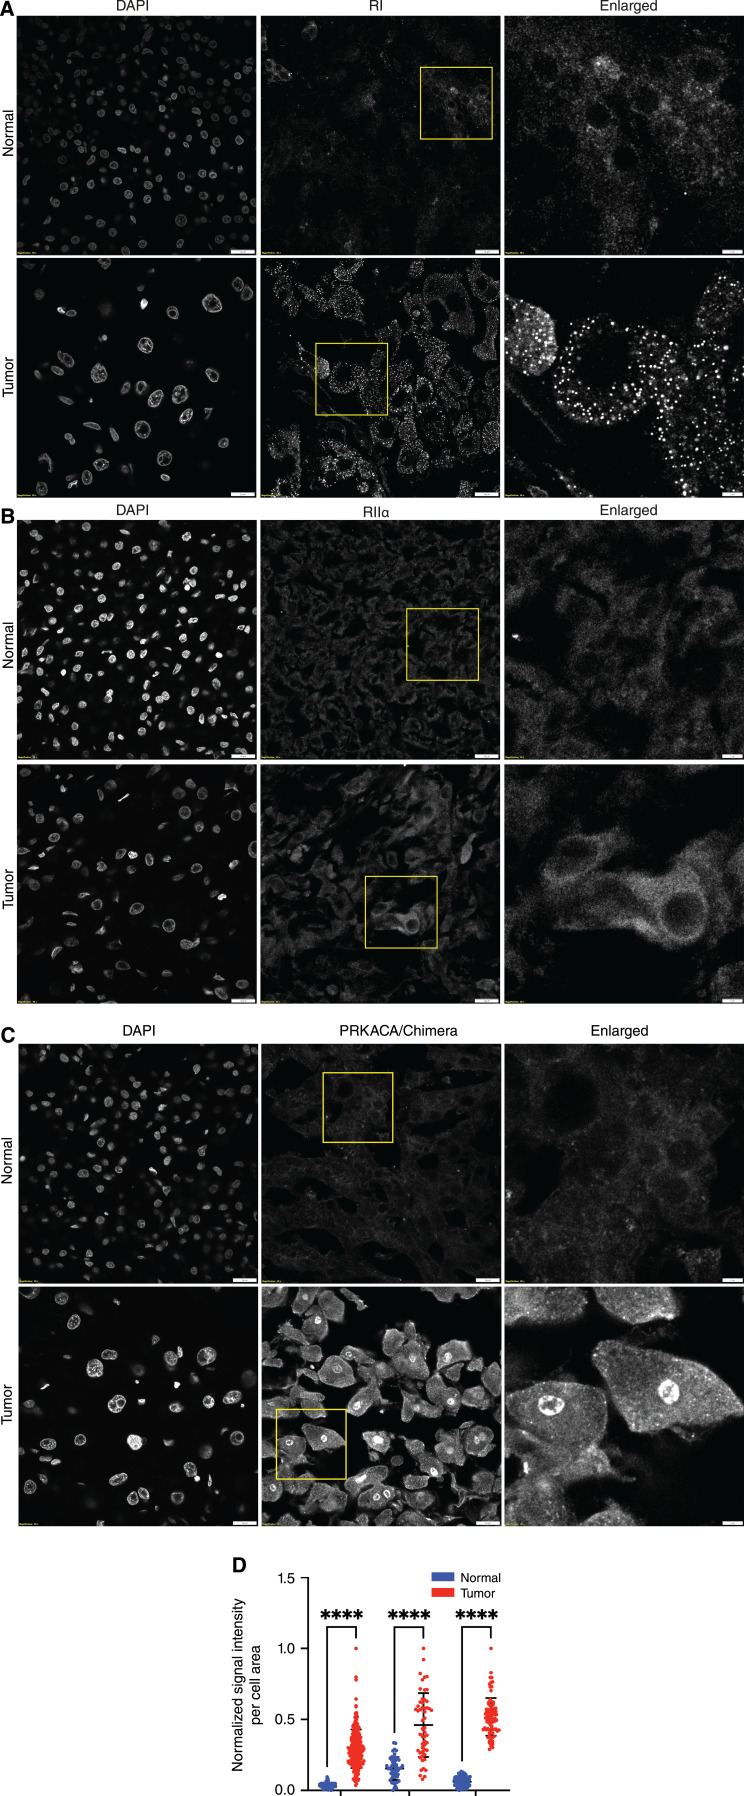
Figure 4.
Distribution of RI(α/β), RIIα, and C. A–C, Representative immunofluorescence images of FLC tumor and adjacent normal liver incubated with DAPI and antibody against RI (α/β) subunits (A), antibody against RIIα subunit (B), antibody against PRKACA/DNAJB::PRKACA (C). Scale bar in the left and middle column, 20 μm; right column, 5 μm. D, Quantification of PRKACA/DNAJB1::PRKACA signal in the nuclei of FLC cells (red) and adjacent normal liver tissue (blue) from three different patients. Statistics were done using two-way ANOVA in PRISM. ****, P < 0.0001.

