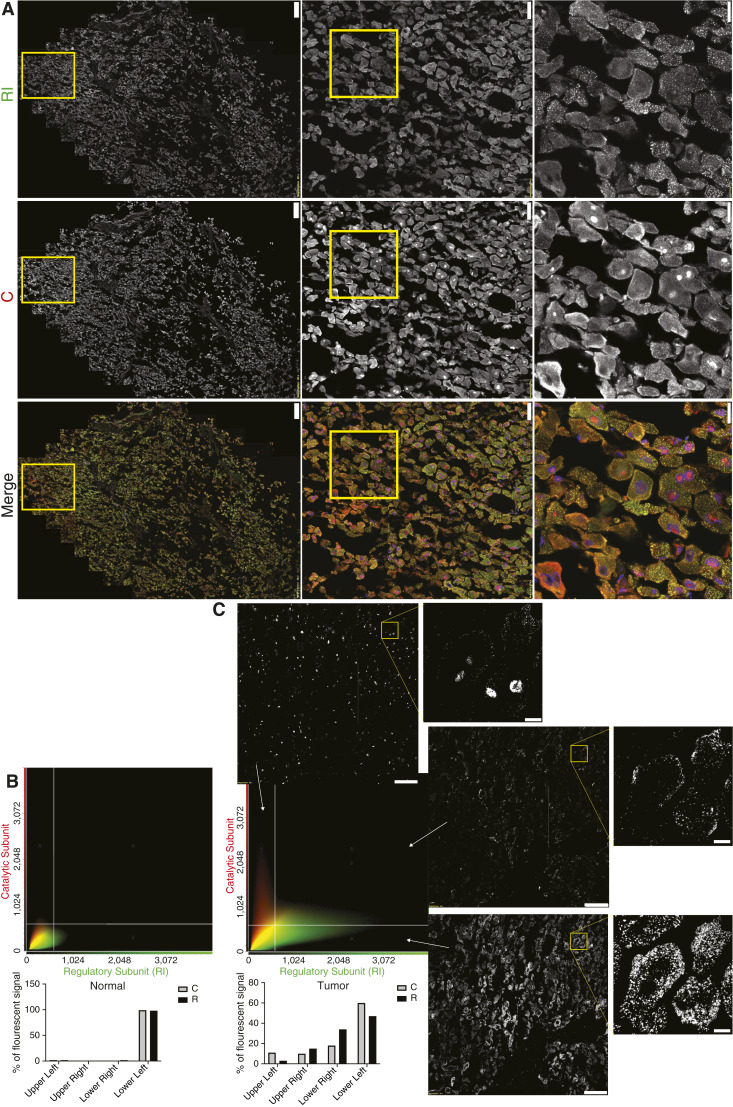
Figure 5.
Distribution and colocalization of RI and C. A, Immunofluorescent image of FLC tumor, showing the localization of RI (top), C (middle), and the merged (bottom) images. Scale bars, left, 200 μm; middle, 50 μm; right, 20 μm. B and C, Colocalization analysis of PRKACA/DNAJB1::PRKACA and RI in nontransformed (B) and adjacent FLC tumor (C) from (A). Scatterplot and quantification of PRKACA/ DNAJB1::PRKACA (red) and RI (green) pixel intensities of the FLC cells (right) and adjacent normal (left). A representative field from the tumor was selected where the intensity of C and RI were plotted for each pixel in each of the three quadrants (cellSens software, Olympus). Scale bars, left images, 100 μm; right enlarged image, 10 μm.

